Bozeman GHG Emission Report

Transform your PDFs into Flipbooks and boost your revenue!
Leverage SEO-optimized Flipbooks, powerful backlinks, and multimedia content to professionally showcase your products and significantly increase your reach.
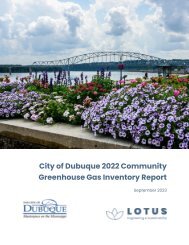
City of Bozeman
2020 Community
Greenhouse Gas
Emissions Inventory
Report
Prepared by
- 1 -
Table of Contents
Executive Summary ES-1
Introduction 1
An Overview of 2020 Emissions 5
Year-Over-Year Comparison21
Carbon Sequestration32
Summary37
Appendix A: Data Sources38
Appendix B: Emissions Factors40
Table of Tables
Table 1. Annual greenhouse gas emission intensities in Bozeman, the US, and globally. .....................................................7
Table 2. Bozeman’s 2020 greenhouse gas emissions by sector and source. ..........................................................................19
Table 3. Detailed contributing factors to GHG emissions increases and decreases between 2018 and 2020. ..............30
Table 4. Annual carbon flux within the Bozeman city boundary. ...................................................................................................35
Table 5. Emissions data sources and if they were calculated or estimated in this report. .....................................................38
Table 6. Summary of greenhouse gas emissions factors. ...............................................................................................................40
- i -
Table of Figures
Figure ES 1. 2020 greenhouse gas emissions by sector.........................................................................................................................................
Figure ES 2. Total GHG emissions between 2008-2020 and the City of Bozeman’s 2025 emissions reduction goal (mt CO 2
e). .....
Figure ES 3. Annual per capita greenhouse gas emissions and population growth from 2008-2020. .....................................................
Figure ES 4. US greenhouse gas emissions over time (via New York Times). ..................................................................................................
Figure ES 5. Progress towards the 2020 Bozeman Climate Plan goals.. ...........................................................................................................
ES-1
ES-2
ES-3
ES-4
ES-5
Figure 1. Bozeman City Limits......................................................................................................................................................................................... 3
Figure 2. 2020 greenhouse gas emissions by scope.............................................................................................................................................. 6
Figure 3. Bozeman’s 2020 stationary energy use sector greenhouse gas emissions. .................................................................................. 10
Figure 4. Bozeman’s 2020 transportation sector greenhouse gas emissions. ................................................................................................. 12
Figure 5. Bozeman's 2020 waste sector greenhouse gas emissions. ................................................................................................................ 14
Figure 6. Bozeman’s 2020 greenhouse gas emissions by sector and source. ................................................................................................ 18
Figure 7. Changes in GHG emissions between inventories................................................................................................................................... 22
Figure 8. Progress towards the 2020 Bozeman Climate Plan goals. .................................................................................................................. 23
Figure 9. Year-over-year greenhouse gas emissions by sector (2008-2020)................................................................................................... 25
Figure 10. Year-over-year per capita greenhouse gas emissions and population (2008-2020). ................................................................. 26
Figure 11. Population increases between 2010-2020 in select Montana cities and unincorporated areas. .............................................. 27
Figure 12. Contributing factors to GHG emissions increases and decreases between the 2018 and 2020 inventories. ..................... 29
Figure 13. National trends in greenhouse gas emissions between 2005-2021. ............................................................................................... 31
- ii -
Executive Summary
The natural surroundings of Bozeman are integral to
the community’s quality of life and economy; the clean
environment benefits residents and visitors alike. While
climate disruption continues to impact southwest Montana’s
ecosystems, water resources, public health, agriculture, and
tourist economy, the City of Bozeman’s 2020 Climate Plan
offers a path forward to ensure a more vibrant future for
all residents. Bozeman has set a community-wide goal of
reaching carbon neutrality by 2050, and the pathway to this
goal includes reducing greenhouse gas (GHG) emissions
26% below 2008 levels by 2025 and transitioning to
100% net clean electricity by 2030. Bozeman measures
greenhouse gas emissions bi-annually to monitor progress
towards these goals and to better understand effective
interventions. The following report summarizes the City of
Bozeman’s greenhouse gas emissions in 2020, including
an analysis of emission sources, trends, and an estimate of
terrestrial carbon sequestration.
Figure ES 1. 2020 greenhouse gas emissions by sector.
- ES-1 -
Bozeman developed a 2020 greenhouse gas emissions inventory to track progress toward
reduction goals. Bozeman’s 2020 GHG emissions totaled 548,746 metric tons of carbon dioxide
equivalent (mt CO 2
e) inclusive of all GHG emissions generated in Bozeman from building energy
use, transportation, and waste.
In 2020, building energy emissions were the largest
contributor to Bozeman’s GHG emissions, comprising
58% of total emissions. Transportation emissions
comprised 32% of total emissions, waste emissions
comprised 10%, and refrigerant leakage emissions
comprised 0.2%. See Figure ES 1. National trends follow
a similar pattern with building energy representing the
largest emissions sector followed by the transportation
sector.
Bozeman’s total emissions have increased 5% from
the baseline year of 2008. See Figure ES 2. A key
contributing factor to the overall increase in emissions
since 2008 is population growth within the City of
Bozeman and surrounding areas. Bozeman’s per
capita emissions have decreased 30% from 2008 while
population has increased 50%. See Figure ES 3.
Figure ES 2. Total greenhouse gas emissions between 2008-2020 and
the City of Bozeman’s 2025 emissions reduction goal (mt CO 2
e).
- ES-2 -
Figure ES 3. Annual per capita greenhouse gas emissions and population growth from 2008-2020.
- ES-3 -
Total emissions in Bozeman decreased by 10% in 2020 from the recent inventory in 2018. See Figure ES2. Changes
between 2018 and 2020 reflect similar shifts in emissions patterns across the country. As shown in Figure ES 4,
trends in US emissions decreased between 2018 to 2020 in the transportation, electricity, and buildings sectors.
These decreases are believed to be strongly influenced by the COVID-19 pandemic.
The 2020 GHG inventory reflects the City’s advancement toward its 2020 Bozeman Climate Plan goals. However,
continuous action is needed to meet the City’s goals and secure a more sustainable future (Figure ES 5).
Figure ES 4. US greenhouse gas emissions over time (via New York Times).
- ES-4 -
Figure ES 5. Progress towards the 2020 Bozeman Climate Plan goals.
- ES-5 -
Introduction
To help Bozeman reach its carbon neutrality goals, the
City has completed a community wide greenhouse
gas (GHG) emissions inventory to measure and identify
sources of emissions within the community.
GHG emissions are heat-trapping gases that contribute
to climate change through atmospheric warming. The
primary GHG emissions are carbon dioxide (CO2),
methane (CH4), nitrous oxide (N2O) and fluorinated
gases – hydrofluorocarbons (HFCs), perfluorocarbons
(PFCs), sulfur hexafluoride (SF6), and nitrogen trifluoride
(NF3). While carbon dioxide, methane, and nitrous
oxide come from a variety of natural sources, humanrelated
emissions of these gases are responsible
for the substantial increase that has occurred in the
atmosphere since the Industrial Revolution. Today,
global greenhouse gas emissions are higher than at
any time during the last 650,000 years. * Human-related
GHG emissions are often produced as a result of
burning fossil fuels (coal, natural gas, oil) for buildings
and transportation, industrial activity, agriculture, solid
waste decomposition, wastewater treatment, and other
activities.
Lotus Engineering and Sustainability, LLC (Lotus) was
hired to complete the 2020 calendar year community
wide GHG emissions inventory. The inventory was
developed using the standard methodology outlined
in the Global Protocol for Community-Scale GHG
Inventories (GPC) for a BASIC inventory. BASIC
inventories include emissions generated from building
energy, transportation, and waste.
Additional emission sources (sometimes referred to as
BASIC+ sources), such as electricity transmission and
distribution (T&D) losses and transboundary aviation, **
were included in the 2020 inventory. Unless otherwise
noted, all emission totals in this report include BASIC+
sources. See the subsection titled BASIC+ Emissions for
more information. This report also estimates the
* ACS Climate Science Toolkit
** Per the GPC protocol, “The transportation emissions from large regional transit hubs (e.g., airports or seaports) serving the city, but outside of the geographic
boundary, should be counted in scope 3. These emissions are driven by activities within the city and should be included to provide a more holistic
view of the city’s transportation sector.”
- 1 -
average annual net carbon flux from Bozeman’s land
and forests within the city boundary. See subsection
Carbon Sequestration for more information.
The following report reviews 2020 GHG emissions
sectors and sources, and progress toward Bozeman’s
climate goals.
Inventory Boundary
Per the GPC, communities shall establish a geographic
boundary that identifies the spatial dimensions or
physical perimeter of the inventory’s boundary. The
boundary for the Bozeman inventory reflects the
physical City limits (Figure 1).
Moving forward the City has committed to publicly reporting
emissions every two years with the next inventory reflecting 2022.
Greenhouse gas inventories help the City monitor emissions trends
and recognize reduction opportunities.
- 2 -
Figure 1. Bozeman City Limits.
- 3 -
Note on COVID-19 Impacts
While Bozeman’s total emissions decreased from 2018
to 2020, it is important to note that 2020 is an outlier
year due to the COVID-19 pandemic. National trends
saw reduced travel, decreased commercial energy
usage, and increased waste disposal. With more
people working from home and traveling less, there
were fewer commuting and air travel emissions. As
businesses slowed and closed operations, commercial
building energy emissions decreased. Increased use
and disposal of single-use items significantly increased
waste emissions. The 2020 drop in national and local
emissions does not necessarily represent a new normal
and it is unlikely these reductions will be durable without
sustained systemic change.
- 4 -
An Overview of 2020 Emissions
Emissions By Scope
Emission sources fall into one of three scope categories, which vary depending on the emissions point of release in
relation to the city boundary.
Scope 1 includes
GHG emissions from
sources within the
city boundary, such
as building fuel use
(other than electricity),
vehicle activity within
the City, and compost
deposited within city
limits.
Scope 2 includes
emissions from the
use of grid-supplied
electricity, heat, steam,
and cooling within the
city boundary.
The only scope 2 emission source
for Bozeman is grid-supplied
electricity, including electric use by
electric vehicles.
Scope 3 emissions
include all other GHG
emissions occurring
outside the city as
a result of activities
within the City
boundary.
For example, landfilled waste is a
scope 3 emission for Bozeman, as
waste generated in Bozeman is
taken to be disposed of outside the
city boundary.
- 5 -
Scope 1 emissions accounted for 58% of Bozeman’s
total emissions (317,702 mt CO2e). On-road vehicle
fuel combustion, residential natural gas usage, and
commercial and industrial electricity usage were the
three largest contributors to scope 1 emissions in 2020.
Scope 2 emissions from grid-supplied electricity made
up 26% of total emissions from the City (142,096 mt
CO 2
e). Scope 3 emissions made up 16% of Bozeman’s
emissions (88,949 mt CO2e), with landfilled waste and
emissions from the Yellowstone/Bozeman International
Airport making up the majority of scope 3 emissions.
Figure 2 shows the percentage of emissions from each
scope. *
* As noted above, additional Scope 3 emission sources (sometimes
referred to as BASIC+ sources) from transmission and distribution (T&D) losses
and transboundary aviation were calculated for the 2020 inventory. See the
subsection titled BASIC+ Emissions for more information.
Figure 2. 2020 greenhouse gas emissions by scope.
- 6 -
Normalized Emissions
Bozeman’s population of 53,293 in 2020, emissions per resident were approximately 10.3 mt CO2e. Bozeman per
capita emissions are lower than US average emissions per capita by approximately 30%. The lower per capita
emissions rate is driven by lower industry-related emissions compared to other cities, as well as newer and more
efficient buildings. Per capita emission intensities are shown in Table 1.
Table 1. Annual greenhouse gas emission intensities in Bozeman, the US, and globally.
Metric
2018 Annual Greenhouse Gas
Emissions (mt CO2e)
2020 Annual Greenhouse Gas
Emissions (mt CO2e)
Bozeman per capita 12.5 10.3
National per capita * 15.8 13.5
International per capita 4 4.8 4.5
* National and international annual per capita emissions data are from Statista; data are from 2018 & 2020.
- 7 -
Emissions sectors are the broad categories of activities that result in GHG emissions. Bozeman’s inventory is split into
the following emissions sectors:
Stationary Energy: emissions sourced from buildings
(electricity and natural gas usage), propane and
diesel combustion, and transmission and distribution
losses (T&D).
Transportation: emissions originating from gas and
diesel vehicles, aviation, transit and electric vehicles,
and T&D losses from electric vehicles.
Solid Waste and Wastewater Treatment: emissions
released from organic material, solid waste this is
inclusive of transportation, collection, and processing
of waste.
Industrial Processes and Product Use: emissions
stemming from refrigerant leaks in building heating,
ventilation, and air conditioning (HVAC) systems.
Each sector contains individual sources, which represent the specific activities resulting in the emissions. Emissions
sectors and the sources within them are further discussed in the following subsections. A summary of emissions from
BASIC+ emissions, which captures all scope 1, 2, and 3 emissions sources, is included following the emission sector
summaries.
- 8 -
Stationary Energy
Emissions from stationary energy accounted for 57 percent of Bozeman’s
total GHG emissions (315,412 mt CO2e).
The stationary energy sector includes emissions from
buildings, primarily from electricity and natural gas
usage. Other sources of stationary energy emissions
include propane and diesel combustion, as well as
T&D losses. Fugitive emissions, or emissions from the
sourcing, transport, and leakage of natural gas, are
also included.
Figure 3 breaks down the specific sources of
stationary energy emissions. Overall, electricity use,
including T&D losses, accounted for 48% (150,733 mt
CO2e) of stationary energy emissions, and natural
gas use, including fugitive emissions, made up 51%
(160,645 mt CO2e). Propane, residential wood, and
stationary diesel together accounted for the remaining
stationary energy emissions (see Table 2).
Splitting energy use by building type provides a more
detailed understanding of the sources contributing
to stationary energy emissions. In 2020, commercial
buildings (e.g., shops, offices, hotels, warehouses,
and other places of business) accounted for 56%
of Bozeman’s stationary energy emissions (175,646
mt CO2e), while homes made up 44% of stationary
energy emissions (139,765 mt CO2e). Commercial
natural gas usage was the largest source of stationary
energy emissions (91,589 mt CO2e). Commercial
building emissions decreased by 13% from 2018 while
residential building emissions decreased by 3% over
the same period. This is largely due to COVID-19
impacts and restrictions that prevented employees
from working from the office and students from
attending school and forced them to work and learn
from home instead.
- 9 -
- 10 -
Figure 3. Bozeman’s 2020 stationary energy use sector greenhouse gas emissions.
Transportation
The transportation sector accounted for 32 percent of Bozeman’s total GHG
emissions (177,593 mt CO2e).
Figure 4 provides a breakdown of the contributing
sources to emissions from the transportation sector.
Emissions from gasoline vehicles (including emissions
from ethanol) made up 53% of transportation emissions
(95,008 mt CO2e) and diesel vehicles made up 24%
(41,932 mt CO2e). Aviation emissions made up 23% of
transportation emissions (39,999 mt CO2e). * Together,
transit vehicles, electric vehicles, and T&D losses from
electric vehicle charging made up under one percent
of total transportation emissions. See Table 2 for more
detail. Between 2018 and 2020, transportation
emissions decreased by 23%. These reductions can
be attributed to COVID-19 impacts and restrictions that
limited travel within Bozeman and across the country.
This trend mirrors the National trend in transportation
emissions between 2018 and 2020, see Figure 13. The
high emissions stemming from gas and diesel vehicles
(77%) mirrors national trends, the data conveys an
opportunity for more sustainable travel.
* Per the GPC protocol, transboundary aviation is defined as “The transportation emissions from large regional transit hubs (e.g., airports or seaports) serving
the city, but outside of the geographic boundary, should be counted in scope 3. These emissions are driven by activities within the city and should be included to
provide a more holistic view of the city’s transportation sector.”
- 11 -
- 12 -
Figure 4. Bozeman’s 2020 transportation sector greenhouse gas emissions.
Waste and Wastewater
Waste and wastewater emissions made up nine percent of Bozeman’s total
2020 emissions (54,856 mt CO2e).
The solid waste generated in Bozeman is disposed
of outside the City boundary at Logan Landfill.
Some organic material is taken outside of the City
boundary for composting, while other organic material
is composted within City limits. Solid waste from
residential, commercial, and industrial sources made up
67% of total waste and wastewater emissions (36,733
mt CO2e). The closed Story Landfill comprised 26% of
total waste and wastewater emissions (14,388 mt CO2e)
where methane from historically landfilled organic
materials is captured, flared, and converted to CO2
before it is emitted into the atmosphere. Emissions from
the transport, collection, and processing of waste made
up 5% of total waste emissions (2,952 mt CO2e) and
compost made up 1% of total waste emissions (501 mt
CO2e). See Table 2. Composting organic materials, like
yard residuals and kitchen scraps, reduces emissions
compared to landfilling. Solid waste emissions
increased in 2020 from 2018 by 70% due to several
changes. The largest driver in the emissions change
was the updated global warming potential for methane,
which increased the impact of methane emissions by
6%. The global warming potential of methane is the
amount of impact that one metric ton of the greenhouse
gas methane has on global warming compared to
one metric ton of the greenhouse gas carbon dioxide.
Every metric ton of methane emitted creates the same
amount of atmospheric warming as 29.8 metric tons of
carbon dioxide. Methane is the primary greenhouse gas
emitted when solid waste decomposes. Other smaller
factors including COVID-19 impacts on the landfilling of
waste and the increase in population also contributed
to the emissions rise in 2020.
- 13 -
Wastewater treatment was negligible in terms of total
emissions (0.5% of waste emissions and 280 mt CO2e,
Figure 5). All wastewater produced in Bozeman is
treated at the Bozeman Water Reclamation Facility
within the city boundaries. Wastewater treatment
emissions are mostly impacted by population, the
volume of wastewater treated, and treatment processes
at the facility.
Figure 5. Bozeman’s 2020 waste sector greenhouse gas emissions.
- 14 -
Industrial Processes and Product Use
In 2020, emissions from refrigerant leaks made up 0.2% of Bozeman’s total
emissions (886 mt CO2e).
Emissions from refrigerant leaks in building HVAC
systems are the only source included in the industrial
processes and product use sector for Bozeman. These
emissions were estimated assuming that 25% of
Bozeman’s commercial square footage is refrigerated and
a standard 5% leakage rate based on IPCC refrigerant
leakage emissions methodologies. Refrigerant leaks in
building HVAC systems, beyond their emissions impact,
can have significant negative effects on human health
as harmful chemicals and substances are released with
leaks.
- 15 -
BASIC+ Emissions
As noted in the introduction, BASIC+ sources from
electricity transmission and distribution (T&D) losses
and transboundary aviation were calculated for the
2020 inventory. Together these sources accounted
for 48,908 mt CO2e, approximately 9% of overall
emissions.
Transmission and Distribution
Losses
T&D losses represent electricity that is generated
but does not reach intended customers due to
inefficiencies in the transmission and distribution
systems. The T&D loss rate is estimated by the utility,
NorthWestern Energy. These losses can range yearto-year
and can be reduced through the utility making
upgrades to the grid. In 2020, it was estimated that
6.27% of electricity did not make it to the intended
customer resulting in approximately 21 million kWh lost
on the way to Bozeman. The total emissions from these
losses are 8,909 mt CO2e.
- 16 -
Transboundary Aviation
Emissions from Bozeman Yellowstone International
Airport are considered transboundary aviation
emissions due to the airport being outside the City
boundary. Per the GPC protocol, “The transportation
emissions from large regional transit hubs (e.g.,
airports or seaports) serving the city, but outside of
the geographic boundary, should be counted in scope
3. These emissions are driven by activities within
the city and should be included to provide a more
holistic view of the city’s transportation sector.” * Of
the airport’s total 2020 emissions, 39,999 mt CO2e
were attributable to the City of Bozeman (7% of total
emissions). Traditionally, Bozeman has worked with
the airport to determine the proportion of the airport’s
activity that occurs as a result of Bozeman’s residents.
For this inventory, Bozeman assumes that 46.7% of
Bozeman Yellowstone International Airport emissions
are attributable to residents of the city.
* See page 72 of the Global Protocol for Community-Scale Greenhouse Gas Emission Inventories.
- 17 -
Emissions by Source
Figure 6 shows the percentage of emissions produced by each sector and source, while Table 2 displays the quantity
of emissions. Emissions from each sector are described in more detail in the previous sections. The largest sources of
Bozeman’s emissions are on-road gasoline and commercial natural gas use, each comprising 17% of total emissions.
The next largest emissions source is commercial electricity usage, comprising 14% of total emissions.
- 18 -
Figure 6. Bozeman’s 2020 greenhouse gas emissions by sector and source.
Table 2. Bozeman’s 2020 greenhouse gas emissions by sector and source.
Emissions Sources
Scope
Emissions
(mtCO2e)
Percent
Residential Fuel Use 1, 2,3 139,765 25%
Residential Electricity 2 67,369.0 12%
Residential Natural Gas 1 63,666.9 12%
Residential Propane 1 2,062.3 0.4%
Residential Wood 1 233.1 0.04%
Fugitive Emissions 1 2,209.9 0.4%
Transmission/Distribution Losses 3 4,224.0 1%
Commercial Energy 1, 2,3 175,646 32%
Commercial Electricity 2 74,470.3 13.5%
Commercial Natural Gas 1 91,588.8 17%
Commercial Propane 1 1,670.9 0.3%
Commercial Diesel 1 68.0 0.01%
Fugitive Emissions 1 3,179.0 1%
Transmission/Distribution Losses 3 4,669.3 0.5%
- 19 -
Emissions Sources
Scope
Emissions
(mtCO2e)
Percent
Transportation 1, 2, 3 177,593 32%
On-Road Gasoline 1 95,007.7 17%
On-Road Diesel 1 41,932.5 8%
On-Road Electricity 2 272.4 0.05%
Transit 1 381.3 0.1%
Aviation 3 39,998.8 7%
Waste 1, 3 54,856 10%
Landfilled 3 36,733.1 7%
Compost 1,3 501.1 0.1%
Closed Landfill 1 14,388.3 3%
Waste Transport, Collection, and Processing 3 2,952.7 0.5%
Wastewater 1 280.5 0.05%
Industrial Processes and Product Use 1 886 0.2%
Refrigerant Leaks 1 886.3 0.2%
Total 548,746 100%
- 20 -
Year-Over-Year Comparison
New Emissions Sources in 2020
For this iteration of the inventory, new emissions data
was available for the following sources: commercial
stationary diesel use and refrigerant use. The
methodology for estimating residential and commercial
propane was modified from previous inventories
that used national and statewide statistical data to
estimate usage. In 2020, propane consumption was
estimated based on usage estimates from one of the
primary propane providers in Bozeman. Data from
these sources was found to be reliable and replicable
and was therefore included in the 2020 inventory. See
Appendix A for specific data sources. It should be noted
that this inventory uses the most recent global warming
potentials (GWP) for methane and nitrous oxide from
the Intergovernmental Panel on Climate Change’s Sixth
Assessment Report. The methane GWP increased from
28 to 29.8 and nitrous oxide GWP increased from 265
to 273.
Year-Over-Year Emissions
Bozeman has faced the local challenge of rapid
population growth and development, along with the
national challenge of COVID-19, which influenced
emissions in 2020. Year over year comparisons help
Bozeman better understand patterns overtime to create
effective change (Figure 7). Bozeman’s total emissions
have increased 5% since the baseline year of 2008,
but the trend has fluctuated. Bozeman saw increased
emissions from 2008 to 2012, which was followed
by decreased emissions from 2012 to 2016. This was
largely due to a reduction in the carbon intensity of grid
supplied electricity and commercial building efficiency
improvements. The increase in emissions from 2016
to 2018 was largely related to population growth, and
the decrease in emissions from 2018 to 2020 was
influenced by the COVID-19 pandemic. Continued work
to reduce Bozeman’s contribution to climate change,
through City-led programs, community initiatives, and
individual actions, is needed to meet the emissions
reduction goals identified in the 2020 Bozeman Climate
Plan (Figure 8).
- 21 -
Figure 7. Changes in GHG emissions between inventories. Red arrows indicate an increase in emissions from the previous inventory, while
green arrows indicate a decrease in emissions from the previous inventory.
- 22 -
Figure 8. Progress towards the 2020 Bozeman Climate Plan goals.
- 23 -
Year-Over-Year Emissions by Sector
Since 2008 solid waste emissions increased 69%
and transportation emissions increased 16%, primarily
due to the increased Global Warming Potential (GWP)
of methane and increase of Vehicle Miles Traveled
within the City boundary. Other sectors have been
decreasing overtime including: wastewater treatment
emissions decreased 70%, commercial and industrial
building energy usage emissions decreased 6%, and
residential building energy usage emissions decreased
18% (Figure 9). The decreasing emissions are largely
attributed to more efficient commercial buildings and
the reduced use of commercial buildings during the
COVID-19 pandemic.
Compared to the most recent inventory year of 2018,
Bozeman’s total emissions have decreased 10%.
Between these two years, solid waste emissions
increased 70%, while residential building energy
usage emissions decreased 3%, commercial and
industrial building energy usage emissions decreased
13%, wastewater treatment emissions decreased
7%, and transportation emissions decreased 23%.
The fluctuations since 2018 follow national trends of
emissions reductions due to COVID-19 in each sector.
- 24 -
Figure 9. Year-over-year greenhouse gas emissions by sector (2008 to 2020).
- 25 -
Per Capita Emissions
In contrast to total emissions, Bozeman’s per capita
emissions have decreased 30% from the baseline
year (Figure 10). Between 2018 and 2020, per capita
emissions have decreased 18% while Bozeman’s
population increased by 9% (48,751 to 53,293). This
means that residents are generating fewer emissions
per person in 2020 compared to 2018.
Since Bozeman’s 2008 baseline inventory year, the City
of Bozeman’s population has experienced sustained
and rapid growth. The City’s population increased
50% between 2008 and 2020 (Figure 10). During this
same period, the cities and unincorporated areas
surrounding Bozeman grew at a comparable rate or
faster. This regional growth contributes directly to traffic
and economic activity in Bozeman, which influence
emissions. Other major cities in Montana, such as
Missoula, Helena, and Whitefish, have also experienced
significant growth, but at a comparatively lower rate.
Figure 10. Year-over-year per capita greenhouse gas emissions and
population (2008-2020).
- 26 -
Figure 11. Population increases between 2010-2020 in select Montana cities and unincorporated areas. *
* Montana Department of Commerce Census & Economic Information Center
- 27 -
Other Drivers of Emissions Changes
While COVID-19 pandemic impacts drove a large
portion of the emissions reductions between 2018
to 2020, there were other forces at play which also
contributed to changes in emissions. Energy use
and other input data were analyzed using the ICLEI
Contribution Analysis tool for their influence on
emissions changes. Between 2018 and 2020, larger
drivers of emissions increases were the growth in
population, increase in number of jobs, increases
in waste generation, and a slightly warmer summer.
Drivers of emissions reductions between the two years
include decreased vehicle miles traveled per person,
a cleaner electric fuels mix, and a warmer winter. See
Figure 11 and Table 3. Note that several emissions
sources were not analyzed by the ICLEI Contribution
Analysis tool, such as aviation, transit, and wastewater
treatment, as these sources are more nuanced and
require a more complex analysis to determine their
impact on emissions trends.
- 28 -
Figure 12. Contributing factors to GHG emissions increases and decreases between the 2018 and 2020 inventories.
- 29 -
Table 3. Detailed contributing factors to GHG emissions increases and decreases between the 2018 and 2020 inventories.
Contributing Factor
Emissions Change
(mt CO2e)
Emissions Change
(mt CO2e)
50,156
Waste model difference 33,678
Growth in employment 13,199
Increased therms per
household
2,217
Refrigerants 886
Hotter summer 396
EVs 256
Fugitive Emissions 210
Stationary Diesel 68
Compost 12
Contributing Factor
Emissions Change
(mt CO2e)
Wastewater -23
Aviation -848
Residential Wood -1,082
T&D Losses -1,404
Heating fuels mix -2,064
More households using
electric heat
-2,322
Warmer winter -4,889
Decreased commercial therms
per job
Decreased on-road emissions
per mile
Decreased waste generation
per person
Decreased commercial kWh
per job
-9,491
-11,625
-13,317
-14,091
Decreased kWh per household -21,209
Electricity fuel mix -21,371
Off-road -25,178
Decreased VMT per person -28,746
- 30 -
Comparison with National Trends
City of Bozeman emissions were reduced by 10% between 2018 to 2020. The building energy and transportation
sectors decreased emissions while the waste sector emissions increased. These trends mirror trends at the National
level. In the US, emissions also decreased between 2018 to 2020 and saw significant COVID-related decreases to
the transportation sector and positive impacts of the greening of the electricity grid on electricity sector emissions
(Figure 12). National data from 2021 suggests that GHG emissions will likely increase as the world recovers from the
COVID-19 pandemic.
Figure 13. National trends in greenhouse gas emissions between 2005-2021.
- 31 -
Carbon Sequestration
Bozeman’s parks and urban
forests provide a myriad
of ecosystem benefits and
services. Urban forests help
filter air and water as well as
provide cooling and public
health benefits. They also
perform a vital function of
removing carbon dioxide out
of the air, which is commonly
referred to as sequestration.
Terms and Definitions
Terrestrial carbon sequestration is the process by
which atmospheric carbon dioxide is taken up by
plants through photosynthesis and stored as carbon
in biomass and soils. The plants and soil that hold the
carbon taken from the atmosphere make up a carbon
sink. The quantity of carbon stored in the plants and soil
is the carbon stock. Plants are continually taking in the
carbon from the atmosphere and storing it. But when
plants senesce, decompose, burn, or land changes
from one cover type to another (i.e., from grassland
to developments), carbon gets released back into the
atmosphere, known as the carbon cycle. Emissions are
the loss of carbon to the atmosphere (positive value)
and removals are the carbon sequestered from the
atmosphere (negative value); net carbon flux is the
sum of emissions and removals. Ecosystems provide a
natural carbon sink through trees, soils, grasslands,
- 32 -
etc. Emissions from land and forests occur as part of the
natural carbon cycle, but emissions can occur following
disturbance events, such as fire, insects and diseases,
or land-use changes. Typically, in the United States,
land and forests are a net carbon sink, rather than a
source of greenhouse gas emissions. *
Methodology
To estimate Bozeman’s greenhouse gas emissions
and removals from Bozeman’s land and forests, the
ICLEI, Local Governments for Sustainability (ICLEI)
Land Emissions and Removal Navigator (LEARN)
tool was used across Bozeman city limits. The ICLEI
LEARN tool estimates the average annual emissions
and removals from forests and trees outside forests
based on geospatial and cover type data (i.e., forest
land, grassland, cropland, wetland, settlement, and
other lands). Comparing two time periods provides an
estimation of changes in both emissions and removals
of carbon, the carbon flux.
The boundary of the carbon flux analysis includes
Bozeman city limits The ICLEI LEARN tool applies
emission and removal factors for both forests and trees
outside of forests (urban tree canopy). Forest factor
sets are applied to large tracts of trees that may be
present in parks, flood plains, or other areas. Trees
outside of forest factor sets are applied to the more
sparsely spaced trees typical of residential streets. For
Bozeman, only trees outside of forest factor sets were
used, as there are no extensive forested areas within
the city limits. Default trees outside forests emission
and removal factors are provided from a benchmark
city that is selected based on geography and climate.
Casper, WY, was identified as the most similar
benchmark city, though it is comparatively drier and
warmer than Bozeman. The land cover layer sourced
data from the National Land Cover Dataset (NLCD) for
the years 2011, 2013, 2016, and 2019 are at 30-meter
resolution, and an overall accuracy of 86.6% at the
Anderson Classification System, ** Level I vegetation
classification. The tree canopy layer sourced data from
the NLCD of those same years is also at 30-meter
* Carbon Stocks, Fluxes and the Land Sector, Michgan State Univeristy (2022).
** A Land Use and Land Cover Classification System for Use with Remote Sensor Data, GEOLOGICAL SURVEY PROFESSIONAL PAPER 964 (1976).
- 33 -
resolution, and the data contains percent tree canopy
estimates as a continuous variable for each pixel across
all land covers and types and are generated by the
United States Forest Service (USFS). Gain or loss of
tree canopy within the city limits is then applied to the
appropriate emissions and removal factors to determine
the carbon flux.
Results
Bozeman’s trees and forests removed over a nine-year
period on average removed -1,559 metric tons of CO2e
per year. The average emissions from Bozeman’s urban
tree canopy forested land were 21 metric tons of CO2e
per year. When carbon dioxide emissions are deducted
from removals, the balance is -1,548 metric tons of
carbon dioxide sequestered per year (Table 4).
30-meter resolution of the geospatial land cover data.
In this dataset the confidence interval range for the
net greenhouse gas balance on average ranges from
-851 metric tons of CO2e per year to -2,204 metric tons
of CO2e per year. In addition, the NLCD only contains
trees outside of forest imagery for the years 2011 and
2016, thus the analysis of 2011 to 2013 and 2013 to
2016 have the same removals, emissions, and net
balance numbers. The NLCD is expected to have 2019
trees outside of forest data soon, but was not available
for this analysis. Other ways to improve the data is to
obtain high resolution tree canopy data from a third
party, but that would still require two time periods of
identical analysis to apply the change in urban tree
canopy to the trees outside of forests emissions and
removal factors.
The LEARN tool reports uncertainty in the net
greenhouse gas balance as high as +/- 45% with a
95% confidence interval (CI) largely attributed to the
- 34 -
Table 4. Annual carbon flux within the Bozeman city boundary.
City
Boundary
Average
(2011-2019)
High end
range of
+45% error
Low end
range of
-45% error
Total
Removals
(t CO2e/yr)
Total
Emissions
(t CO2e/yr)
Net GHG
Balance
(Carbon
Flux)
-1,559 21 -1,548
-2,261 30 -2,245
-857 11 -852
Based on current protocol guidance, Bozeman’s net
greenhouse gas average annual net flux of carbon
of -1,548 metric tons of CO2e per year is provided for
informational purposes and was not deducted from
Bozeman’s overall greenhouse gas emissions total of
548,746 metric tons CO2e.
Beyond carbon sequestration, this analysis does not
attempt to quantify the direct and indirect ecosystem
benefits of parks and urban forests that create a healthy
environment for residents and urban wildlife. Among
the many co-benefits, trees intercept particulate matter
and reduce air pollution, while providing shade that
can reduce the urban heat island and the cooling
load of buildings. Plants and soils also act as a filter
before water enters streams and groundwater. These
ecosystem benefits are interconnected to Bozeman’s
quality of life and economy but are not quantified within
the LEARN tool.
Despite these limitations, the annual carbon
sequestration estimates from the LEARN tool are a step
towards quantifying the carbon flux of Bozeman’s urban
natural systems over time and provide an indication of
the local carbon sequestration potential. Since climate
change impacts can lead to a decline in carbon stock
through disturbance events such as insects and disease
or high-intensity wildfire, understanding these impacts
- 35 -
improves our ability to manage and protect Bozeman’s
carbon stock. Examples of land management strategies
to maintain carbon stocks may include enhancing
species diversity of the urban forest and land use
planning to minimize forest, grassland, and wetland
conversion to other land cover types.
From the LEARN tool analysis, the results provide a
preliminary estimate of Bozeman’s carbon stock. In
future years, the accuracy of the carbon stock estimate
could be improved with higher resolution data and
establishing urban forest emissions and removal factors
specific to Bozeman. Knowledge of Bozeman’s carbon
stock can help inform land management practices and
enhancements that support natural climate solutions to
reduce emissions and improve community resilience.
While annual removals may seem small, it is critical
to maintain and enhance existing urban tree canopy
whenever possible. Disturbances such as insect
infestations and removal of healthy urban trees can
create larger “pulses” of emissions. Trees remain an
essential tool in conserving existing carbon stock and
ensuring a carbon flux results in net removals.
- 36 -
Summary
Bozeman’s 2020 GHG inventory illustrates the City’s
progress toward its climate goals. Although Bozeman’s
emissions have increased by 5% since the 2008
baseline, the City’s emissions decreased 10% from
the most recent inventory in 2018 and per capita
emissions declined by 18%. While this decrease may
be attributable to the COVID-19 pandemic, the practical
outcome is that the Bozeman community contributed
fewer greenhouse gas emissions to the atmosphere in
2020.
With accelerated emissions reductions, there is still an
opportunity to achieve our community climate goals
under the adopted framework of the 2020 Bozeman
Climate Plan, which features solutions and actions to
transition to low-carbon energy and transportation
systems, pedestrian-oriented neighborhoods, and
nature-based solutions for urban cooling and disaster
resilience.
Measuring emissions helps Bozeman track progress
and understand new opportunities to reduce our
contribution to climate change. Monitoring emissions
also builds an understanding of areas where we have
agency, and areas that may require partnerships and
collaboration.
- 37 -
Appendix A: Data Sources
Table 5. Emissions data sources and if they were calculated or estimated in this report.
Emissions Source
Data Source
Were Emissions Calculated or
Estimated?
Building Electricity Use NorthWestern Energy Calculated
Building Natural Gas Use NorthWestern Energy Calculated
Building Propane Use Amerigas Calculated
Building Stationary Diesel Use
US Census ACS House heating Fuel
Survey data, Bozeman commercial
square footage data, CBECS data,
Estimated
and US EIA unit conversions
Fugitive Emissions from Natural Gas GPC Protocol default leakage rate
Leakage
(0.3%)
Calculated
Transmission & Distribution Losses NorthWestern Energy loss rate Calculated
Vehicle Miles Traveled
City of Bozeman and Montana Dept
or Transportation
Calculated
Vehicle Registrations
EPA State Inventory Tool Mobile
Combustion Module
Calculated
Electric Vehicle Registrations Atlas EV Dashboard Calculated
EV Transmission & Distribution Losses NorthWestern Energy loss rate
Calculated
Transit Fuel Use
Human Resources Development
Council
Calculated
- 38 -
Aviation Fuel Use
Emissions Source
Waste and compost tonnage
Closed landfill emissions
Waste transport, collection, and
processing emissions
Wastewater
Refrigerant Leaks
NorthWestern Energy Electric
Emissions Factor
Data Source
Bozeman/Yellowstone International
Airport
Gallatin County Solid Waste, City of
Bozeman
Estimated emissions depreciation
rate via ICLEI
GPC Protocol methodology
City of Bozeman data for Bozeman
WRF
Estimated from commercial square
footage and standard assumptions
and methodology from IPCC
NorthWestern Energy
Were Emissions Estimated or
Calculated?
Calculated
Calculated
Estimated
Calculated
Calculated
Estimated
N/A
- 39 -
Appendix B: Emissions Factors
See Table 6 for an overview of the emission factors that were used for calculations throughout the inventory. The
Notes column provides details as to which emission factors need updated regularly.
Table 6. Summary of greenhouse gas emissions factors.
Stationary Energy Emission Factors—Electricity & Natural Gas
Emission Source GHG Value Unit Source Notes
Electricity
CO 2
0.419
CH 4
0.00003
N 2
O 0.000004
mt CO 2
/
MWh
mt CH 4
/
MWh
mt N 2
O/
MWh
Shown in NorthWestern Energy’s ESG/
Sustainability Template under Montana
Generation Statistics: Montana Owned +
Long Term Contracts for 2020. See line
7.3.2.3 on page 10.
EPA's eGrid: eGRID 2020 summary tables,
table 1, sub region NWPP.
Verify with each
inventory. Likely
that the CO 2
emission factor
will change
annually.
Verify with each
inventory.
- 40 -
Stationary Energy Emission Factors—Electricity & Natural Gas
Emission Source GHG Value Unit Source Notes
CO 2
0.0053
mt CO 2
/
therm
Natural Gas CH 4
0.0000005
mt CH 4
/ 2013 ICLEI US Community Protocol,
therm
Appendix C.
N 2
O 0.00000001
mt N 2
O/
therm
CO 2
0.01
mt CO 2
/ ICLEI’s U.S. Community Protocol for
gallon Accounting and Reporting of Greenhouse
mt CH Gas Emissions (Community Protocol) –
CH 4
0.0000004
4
/
gallon Appendix C: Built Environment Emission Verify with each
Stationary Diesel
Activities and Sources, Version 1.1, July inventory.
N 2
O 0.0000001
generators by the industrial sector.
mt N 2
O/ 2013. Assumes distillate fuel oil number
gallon 2 and that diesel is primarily used in
Propane
CO 2
0.006
CH 4
0.000001
N 2
O 0.0000001
mt CO 2
/
gallon
mt CH 4
/
gallon
mt N 2
O/
gallon
ICLEI’s U.S. Community Protocol for
Accounting and Reporting of Greenhouse
Gas Emissions (Community Protocol) –
Appendix C: Built Environment Emission
Activities and Sources, Version 1.1, July
2013.
- 41 -
Transportation Emission Factors—Ethanol, Gasoline, and Diesel
Emission Source GHG Value Unit Source Notes
CO 2
0.00878
mt CO 2
/
gal
Gasoline
CH 4 Varies by
N 2
O vehicle
g/mile
Diesel
Ethanol
CO 2
0.01
CH 4
N 2
O
Varies by
vehicle
CO 2
0.006
CH 4
N 2
O
Varies by
vehicle
mt CO 2
/
gal
g/mile
mt CO2/
gal
g/mile
EPA estimates as recommended by ICLEI.
Based on vehicles that are 2008 to present
or 2009 to present. Past years utilized ICLEI
Appendix D numbers.
Should remain
constant but
verify with each
inventory.
- 42 -
Transit Emission Factors
Emission Source GHG Value Unit Source Notes
CO 2
0.01
mt CO 2
/
gal
Should remain
Diesel CH 4
0.001
g CH 4
/
constant but
EPA estimates as recommended by ICLEI.
mile
verify with each
N 2
O 0.0015
g N 2
O/
inventory.
mile
Aviation Emission Factors
CO 2
9.75
Kg CO 2
/
gal
Jet fuel CH 4
0.41
g CH4/
gal
Aviation Gasoline
N 2
O 0.08
CO 2
8.31
CH 4
0.36
N 2
O 0.07
g N2O/
gal
kg CO2/
gal
g CH4/
gal
g N2O/
gal
Per guidance from ICLEI on emissions
factors used in the ClearPath tool.
Should remain
constant but
verify with each
inventory.
- 43 -
Waste Emission Factors
Emission Source GHG Value Unit Source Notes
Municipal Solid
Varies by mt CH4/ ton 2013 ICLEI US Community Protocol,
CH
Waste
4
waste type waste
Appendix E.
CH 4
mt CH4/ ton
waste
Recycled Waste
Composted
Waste
N 2
O
Varies by
waste type
CH 4
0.00047
N 2
O 0.00022
CH 4
0.00018
N 2
O 0.00013
mt N2O/
wet short
ton waste
mt CH 4
/ ton
waste
mt N2O/
ton waste
mt CH 4
/ ton
waste
mt N2O/
ton waste
CLEI’s U.S. Community Protocol for
Accounting and Reporting of Greenhouse
Gas Emissions (Community Protocol) –
Appendix C: Built Environment Emission
Activities and Sources, Version 1.1, July
2013.
Documentation for Greenhouse Gas
Emissions and Energy Factors Used in the
Waste Reduction Model (WARM). Assumes
green waste. Values are adjusted to CH4
and N2O emission factors.
Documentation for Greenhouse Gas
Emissions and Energy Factors Used in the
Waste Reduction Model (WARM). Assumes
biowaste. Values are adjusted to CH4 and
N2O emission factors.
Should
remain
constant
but verify
with each
inventory.
Wastewater
CH 4
N 2
O
Varies by
treatment
Varies
2013 ICLEI US Community Protocol,
Appendix F.
- 44 -
Photo Credits
Page ES-1 Trevor Vannoy on Unsplash
Page 1 Lee Peters on Unsplash
Page 4 Chris Montgomery on Unsplash
Page 5 Jennifer Horstmann on Unsplash
Page 15 Matthew Lancaster on Unsplash
Page 17 Anna Gur on Unsplash
Page 21 Bobby Stevenson on Unsplash
Page 28 Matthew Lancaster on Unsplash
Page 32, 40 Olena Sergienko on Unsplash
Page 36 Malachy Marshall on Unsplash
Page 37 Trevor Vannoy on Unsplash
- 45 -
- 46 -
Prepared by