MLSEV Virtual. Searching for Anomalies
0 likes•319 views

The document outlines various methods for anomaly detection, including density estimation, quantile estimation, distance-based methods, and projection methods. It emphasizes the importance of cleaning contaminated data and discusses benchmarking studies that identified isolation forest as the most effective method overall, while quantile methods performed poorly. Three key use cases are highlighted: data cleaning, fraud detection, and run-time monitoring of classifiers.

![Dietterich #MLSEV 16
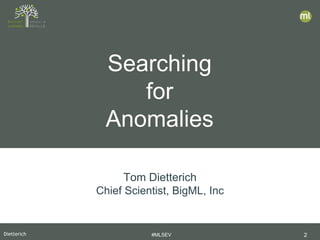
• Construct a fully random binary tree
• choose attribute 𝑗𝑗 at random
• choose splitting threshold 𝜃𝜃1
uniformly from
min 𝑥𝑥⋅𝑗𝑗 , max 𝑥𝑥⋅𝑗𝑗
• until every data point is in its
own leaf
• let 𝑑𝑑(𝑥𝑥𝑖𝑖) be the depth of point 𝑥𝑥𝑖𝑖
• repeat 100 times
• let 𝑑𝑑̅(𝑥𝑥𝑖𝑖) be the average depth of
𝑥𝑥𝑖𝑖
• 𝐴𝐴 𝑥𝑥𝑖𝑖 = 2
−
𝑑𝑑� 𝑥𝑥𝑖𝑖
𝑟𝑟 𝑥𝑥𝑖𝑖
• 𝑟𝑟(𝑥𝑥𝑖𝑖) is the expected depth
Isolation Forest [Liu, Ting, Zhou, 2011]
𝑥𝑥⋅𝑗𝑗𝑥𝑥⋅𝑗𝑗 > 𝜃𝜃1
𝑥𝑥⋅2 > 𝜃𝜃2 𝑥𝑥⋅8 > 𝜃𝜃3
𝑥𝑥⋅3 > 𝜃𝜃4 𝑥𝑥⋅1 > 𝜃𝜃5
𝑥𝑥𝑖𝑖](https://image.slidesharecdn.com/mlsev20bigmltomdietterichanomalies-200331101723/85/MLSEV-Virtual-Searching-for-Anomalies-16-320.jpg)
![Dietterich #MLSEV 17
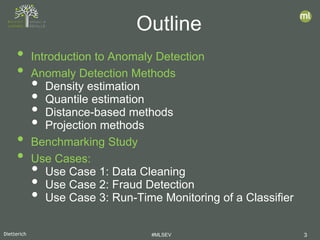
• Goal: Compare published algorithms on a robust collection of benchmarks
• Previous comparisons suffered from small size and/or proprietary data
sets
Benchmarking Study
• Density-Based Approaches
– RKDE: Robust Kernel Density
Estimation (Kim & Scott, 2008)
– EGMM: Ensemble Gaussian Mixture
Model (our group)
• Quantile-Based Methods
– OCSVM: One-class SVM (Schoelkopf,
et al., 1999)
– SVDD: Support Vector Data
Description (Tax & Duin, 2004)
[Emmott, Das, Dietterich, Fern, Wong, 2013; KDD ODD-2013]
[Emmott, Das, Dietterich, Fern, Wong. 2016; arXiv 1503.01158v2]
• Neighbor-Based Methods
– LOF: Local Outlier Factor (Breunig, et
al., 2000)
– ABOD: kNN Angle-Based Outlier
Detector (Kriegel, et al., 2008)
• Projection-Based Methods
– IFOR: Isolation Forest (Liu, et al.,
2008)
– LODA: Lightweight Online Detector of
Anomalies (Pevny, 2016)](https://image.slidesharecdn.com/mlsev20bigmltomdietterichanomalies-200331101723/85/MLSEV-Virtual-Searching-for-Anomalies-17-320.jpg)
![Dietterich #MLSEV 19
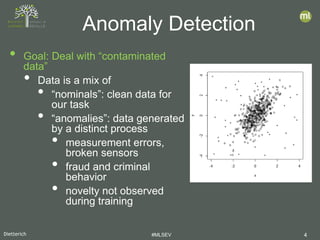
• AUC: Area Under the ROC Curve
• binary decision: Nominal vs. Anomaly
• what is the probability that the algorithm correctly ranks a
randomly-chosen anomaly above a randomly-chosen nominal
point?
• We measure log
𝐴𝐴𝐴𝐴𝐴𝐴
1−𝐴𝐴𝐴𝐴𝐴𝐴
• LIFT: Ratio of precision of algorithm to precision of random
guessing
• Related to Average Precision (AP)
• We measure log
𝐴𝐴𝐴𝐴
𝐸𝐸[𝐴𝐴𝐴𝐴]
Evaluation Metrics](https://image.slidesharecdn.com/mlsev20bigmltomdietterichanomalies-200331101723/85/MLSEV-Virtual-Searching-for-Anomalies-19-320.jpg)
![Dietterich #MLSEV 25
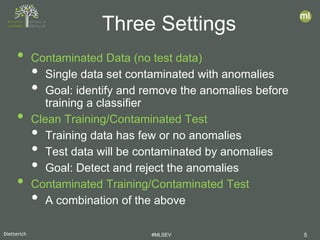
• Approach
• Show top-ranked
candidate to the analyst
• Analyst labels candidate
• Label is used to update
the anomaly detector
Incorporating Analyst
Feedback
Data
Anomaly
Detection
Top-Ranked
Candidate
Convince
Analyst?
Launch Investigation
no
yesAAD [Das, et al, ICDM 2016]
GLAD-OMD [Siddiqui, et al., KDD 2018]](https://image.slidesharecdn.com/mlsev20bigmltomdietterichanomalies-200331101723/85/MLSEV-Virtual-Searching-for-Anomalies-25-320.jpg)

MLSEV Virtual. Searching for Anomalies
- 2. Dietterich #MLSEV 2 Searching for Anomalies Tom Dietterich Chief Scientist, BigML, Inc
- 3. Dietterich #MLSEV 3 • Introduction to Anomaly Detection • Anomaly Detection Methods • Density estimation • Quantile estimation • Distance-based methods • Projection methods • Benchmarking Study • Use Cases: • Use Case 1: Data Cleaning • Use Case 2: Fraud Detection • Use Case 3: Run-Time Monitoring of a Classifier Outline
- 4. Dietterich #MLSEV 4 • Goal: Deal with “contaminated data” • Data is a mix of • “nominals”: clean data for our task • “anomalies”: data generated by a distinct process • measurement errors, broken sensors • fraud and criminal behavior • novelty not observed during training Anomaly Detection
- 5. Dietterich #MLSEV 5 • Contaminated Data (no test data) • Single data set contaminated with anomalies • Goal: identify and remove the anomalies before training a classifier • Clean Training/Contaminated Test • Training data has few or no anomalies • Test data will be contaminated by anomalies • Goal: Detect and reject the anomalies • Contaminated Training/Contaminated Test • A combination of the above Three Settings
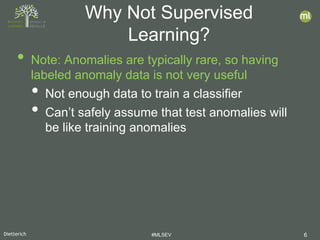
- 6. Dietterich #MLSEV 6 • Note: Anomalies are typically rare, so having labeled anomaly data is not very useful • Not enough data to train a classifier • Can’t safely assume that test anomalies will be like training anomalies Why Not Supervised Learning?
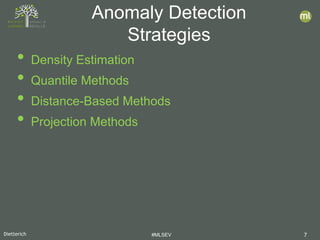
- 7. Dietterich #MLSEV 7 • Density Estimation • Quantile Methods • Distance-Based Methods • Projection Methods Anomaly Detection Strategies
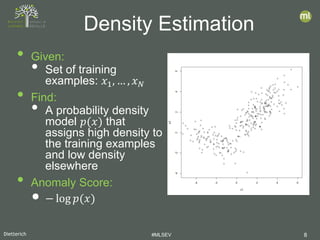
- 8. Dietterich #MLSEV 8 • Given: • Set of training examples: 𝑥𝑥1, … , 𝑥𝑥𝑁𝑁 • Find: • A probability density model 𝑝𝑝(𝑥𝑥) that assigns high density to the training examples and low density elsewhere • Anomaly Score: • − log 𝑝𝑝(𝑥𝑥) Density Estimation
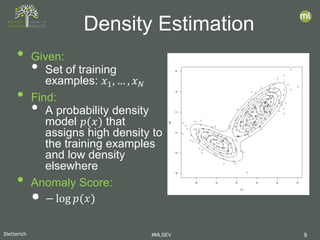
- 9. Dietterich #MLSEV 9 • Given: • Set of training examples: 𝑥𝑥1, … , 𝑥𝑥𝑁𝑁 • Find: • A probability density model 𝑝𝑝(𝑥𝑥) that assigns high density to the training examples and low density elsewhere • Anomaly Score: • − log 𝑝𝑝(𝑥𝑥) Density Estimation
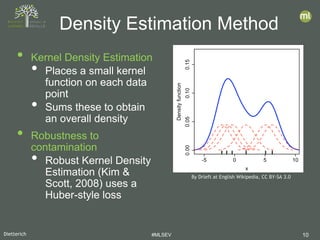
- 10. Dietterich #MLSEV 10 • Kernel Density Estimation • Places a small kernel function on each data point • Sums these to obtain an overall density • Robustness to contamination • Robust Kernel Density Estimation (Kim & Scott, 2008) uses a Huber-style loss Density Estimation Method By Drleft at English Wikipedia, CC BY-SA 3.0
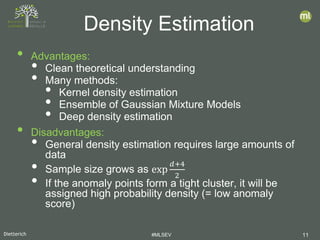
- 11. Dietterich #MLSEV 11 • Advantages: • Clean theoretical understanding • Many methods: • Kernel density estimation • Ensemble of Gaussian Mixture Models • Deep density estimation • Disadvantages: • General density estimation requires large amounts of data • Sample size grows as exp 𝑑𝑑+4 2 • If the anomaly points form a tight cluster, it will be assigned high probability density (= low anomaly score) Density Estimation
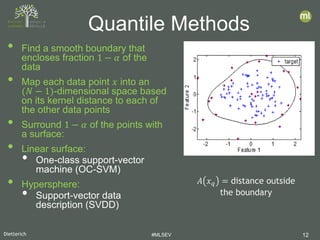
- 12. Dietterich #MLSEV 12 • Find a smooth boundary that encloses fraction 1 − 𝛼𝛼 of the data • Map each data point 𝑥𝑥 into an (𝑁𝑁 − 1)-dimensional space based on its kernel distance to each of the other data points • Surround 1 − 𝛼𝛼 of the points with a surface: • Linear surface: • One-class support-vector machine (OC-SVM) • Hypersphere: • Support-vector data description (SVDD) Quantile Methods 𝐴𝐴 𝑥𝑥𝑞𝑞 = distance outside the boundary
- 13. Dietterich #MLSEV 13 • Advantages: • Amount of training data needed grows as 1 𝜖𝜖2, where 𝜖𝜖 is the accuracy of the 1 − 𝛼𝛼 quantile • Disadvantages: • Requires tuning a kernel function • Algorithms do not scale to large data sets • Does not perform very well for ranking • But see Menon & Willilamson, NeurIPS 2018 for an improvement Quantile Methods
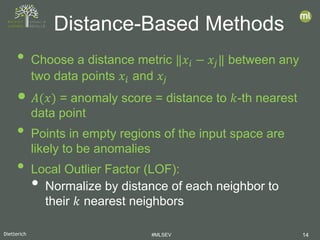
- 14. Dietterich #MLSEV 14 • Choose a distance metric ‖𝑥𝑥𝑖𝑖 − 𝑥𝑥𝑗𝑗‖ between any two data points 𝑥𝑥𝑖𝑖 and 𝑥𝑥𝑗𝑗 • 𝐴𝐴(𝑥𝑥) = anomaly score = distance to 𝑘𝑘-th nearest data point • Points in empty regions of the input space are likely to be anomalies • Local Outlier Factor (LOF): • Normalize by distance of each neighbor to their 𝑘𝑘 nearest neighbors Distance-Based Methods
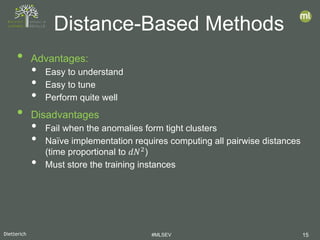
- 15. Dietterich #MLSEV 15 • Advantages: • Easy to understand • Easy to tune • Perform quite well • Disadvantages • Fail when the anomalies form tight clusters • Naïve implementation requires computing all pairwise distances (time proportional to 𝑑𝑑𝑑𝑑2 ) • Must store the training instances Distance-Based Methods
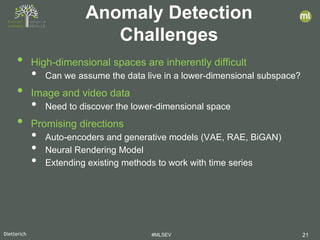
- 16. Dietterich #MLSEV 16 • Construct a fully random binary tree • choose attribute 𝑗𝑗 at random • choose splitting threshold 𝜃𝜃1 uniformly from min 𝑥𝑥⋅𝑗𝑗 , max 𝑥𝑥⋅𝑗𝑗 • until every data point is in its own leaf • let 𝑑𝑑(𝑥𝑥𝑖𝑖) be the depth of point 𝑥𝑥𝑖𝑖 • repeat 100 times • let 𝑑𝑑̅(𝑥𝑥𝑖𝑖) be the average depth of 𝑥𝑥𝑖𝑖 • 𝐴𝐴 𝑥𝑥𝑖𝑖 = 2 − 𝑑𝑑� 𝑥𝑥𝑖𝑖 𝑟𝑟 𝑥𝑥𝑖𝑖 • 𝑟𝑟(𝑥𝑥𝑖𝑖) is the expected depth Isolation Forest [Liu, Ting, Zhou, 2011] 𝑥𝑥⋅𝑗𝑗𝑥𝑥⋅𝑗𝑗 > 𝜃𝜃1 𝑥𝑥⋅2 > 𝜃𝜃2 𝑥𝑥⋅8 > 𝜃𝜃3 𝑥𝑥⋅3 > 𝜃𝜃4 𝑥𝑥⋅1 > 𝜃𝜃5 𝑥𝑥𝑖𝑖
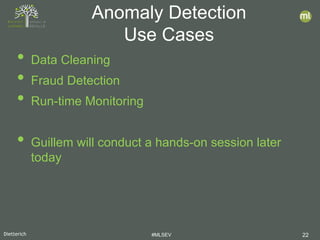
- 17. Dietterich #MLSEV 17 • Goal: Compare published algorithms on a robust collection of benchmarks • Previous comparisons suffered from small size and/or proprietary data sets Benchmarking Study • Density-Based Approaches – RKDE: Robust Kernel Density Estimation (Kim & Scott, 2008) – EGMM: Ensemble Gaussian Mixture Model (our group) • Quantile-Based Methods – OCSVM: One-class SVM (Schoelkopf, et al., 1999) – SVDD: Support Vector Data Description (Tax & Duin, 2004) [Emmott, Das, Dietterich, Fern, Wong, 2013; KDD ODD-2013] [Emmott, Das, Dietterich, Fern, Wong. 2016; arXiv 1503.01158v2] • Neighbor-Based Methods – LOF: Local Outlier Factor (Breunig, et al., 2000) – ABOD: kNN Angle-Based Outlier Detector (Kriegel, et al., 2008) • Projection-Based Methods – IFOR: Isolation Forest (Liu, et al., 2008) – LODA: Lightweight Online Detector of Anomalies (Pevny, 2016)
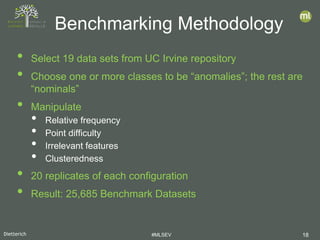
- 18. Dietterich #MLSEV 18 • Select 19 data sets from UC Irvine repository • Choose one or more classes to be “anomalies”; the rest are “nominals” • Manipulate • Relative frequency • Point difficulty • Irrelevant features • Clusteredness • 20 replicates of each configuration • Result: 25,685 Benchmark Datasets Benchmarking Methodology
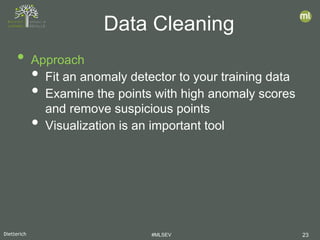
- 19. Dietterich #MLSEV 19 • AUC: Area Under the ROC Curve • binary decision: Nominal vs. Anomaly • what is the probability that the algorithm correctly ranks a randomly-chosen anomaly above a randomly-chosen nominal point? • We measure log 𝐴𝐴𝐴𝐴𝐴𝐴 1−𝐴𝐴𝐴𝐴𝐴𝐴 • LIFT: Ratio of precision of algorithm to precision of random guessing • Related to Average Precision (AP) • We measure log 𝐴𝐴𝐴𝐴 𝐸𝐸[𝐴𝐴𝐴𝐴] Evaluation Metrics
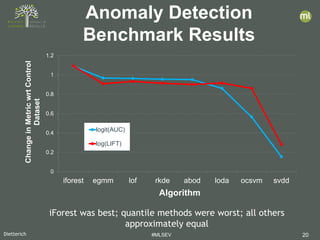
- 20. Dietterich #MLSEV 20 0 0.2 0.4 0.6 0.8 1 1.2 iforest egmm lof rkde abod loda ocsvm svdd ChangeinMetricwrtControl Dataset Algorithm logit(AUC) log(LIFT) Anomaly Detection Benchmark Results iForest was best; quantile methods were worst; all others approximately equal
- 21. Dietterich #MLSEV 21 • High-dimensional spaces are inherently difficult • Can we assume the data live in a lower-dimensional subspace? • Image and video data • Need to discover the lower-dimensional space • Promising directions • Auto-encoders and generative models (VAE, RAE, BiGAN) • Neural Rendering Model • Extending existing methods to work with time series Anomaly Detection Challenges
- 22. Dietterich #MLSEV 22 • Data Cleaning • Fraud Detection • Run-time Monitoring • Guillem will conduct a hands-on session later today Anomaly Detection Use Cases
- 23. Dietterich #MLSEV 23 • Approach • Fit an anomaly detector to your training data • Examine the points with high anomaly scores and remove suspicious points • Visualization is an important tool Data Cleaning
- 24. Dietterich #MLSEV 24 • Approach • Clean your training data as best you can • Train the anomaly detector • Score new transactions • Examine the anomalies in descending order and initiate investigations as appropriate Fraud Detection Data Anomaly Detection Ranked Candidates Convince Analyst? Launch Investigation no yes
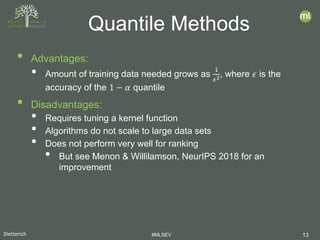
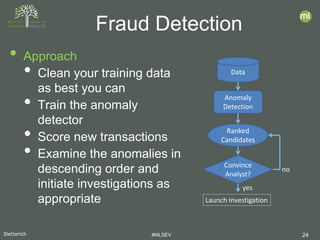
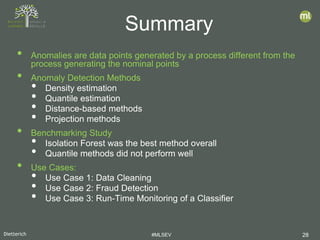
- 25. Dietterich #MLSEV 25 • Approach • Show top-ranked candidate to the analyst • Analyst labels candidate • Label is used to update the anomaly detector Incorporating Analyst Feedback Data Anomaly Detection Top-Ranked Candidate Convince Analyst? Launch Investigation no yesAAD [Das, et al, ICDM 2016] GLAD-OMD [Siddiqui, et al., KDD 2018]
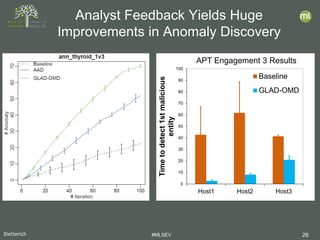
- 26. Dietterich #MLSEV 26 Analyst Feedback Yields Huge Improvements in Anomaly Discovery 0 10 20 30 40 50 60 70 80 90 100 Host1 Host2 Host3 Timetodetect1stmalicious entity Baseline GLAD-OMD APT Engagement 3 Results
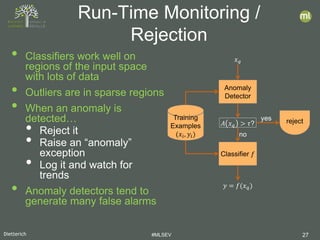
- 27. Dietterich #MLSEV 27 • Classifiers work well on regions of the input space with lots of data • Outliers are in sparse regions • When an anomaly is detected… • Reject it • Raise an “anomaly” exception • Log it and watch for trends • Anomaly detectors tend to generate many false alarms Run-Time Monitoring / Rejection 𝑥𝑥𝑞𝑞 Anomaly Detector 𝐴𝐴 𝑥𝑥𝑞𝑞 > 𝜏𝜏? Classifier 𝑓𝑓 Training Examples (𝑥𝑥𝑖𝑖, 𝑦𝑦𝑖𝑖) no 𝑦𝑦 = 𝑓𝑓(𝑥𝑥𝑞𝑞) yes reject
- 28. Dietterich #MLSEV 28 • Anomalies are data points generated by a process different from the process generating the nominal points • Anomaly Detection Methods • Density estimation • Quantile estimation • Distance-based methods • Projection methods • Benchmarking Study • Isolation Forest was the best method overall • Quantile methods did not perform well • Use Cases: • Use Case 1: Data Cleaning • Use Case 2: Fraud Detection • Use Case 3: Run-Time Monitoring of a Classifier Summary
- 29. Dietterich 29