SlideShare a Scribd company logo
1
A
Research analysis
On
“Impact of Demographic Factors on Employees’ Attitude towards
Training Program”
Submitted to-
Dr. A. C. Bhrambhatt
Submitted by-
Akshay Gaikwad (20165003)
Aquesha Tirmizi (20165005)
Puja Tripathi (20165028)
Radhika Sarda (20165029)
2
Summary
 Purpose
The purpose of this study is to investigate the impact of employees’
demographic factors on their attitude towards training program.
 Approach
The study examined the responses of 100 employees, with different
demographic factors such as their age, gender, qualification, marital status
and designation. The questions asked contained information about the
employee attitudes towards the training program as they perceived, as well as
training in general.
 Findings
The results of the study provide support to the hypotheses proposed,
indicating that there is a significant relation between employees’ demographic
factors and their attitude towards certain factors of training such as
importance of training, training hours, training days, interval between training
and training location.
 Conclusion
Demographic factor of employees have some Impact on their attitude
formation towards training
 Practical Implications
The implications of the findings of this study for managers and especially for
human resource professionals are quite significant, given their roles in
funding, designing and delivering training intervention. Study tells about
present attitude of employees which helps in understanding present
employees’ attitude and design training program to get maximum
participation, improve/influence employees attitude to get more effective
outcome from each training program. And ultimately Design more successful
and efficient training program
 Research limitations
The study is limited to examining employee feelings, perception, attitude, not
taking into account their personal characteristics, which may be important.
3
Abstract
Human resource on most important as that of any business this asset has to
be given proper guideline and continuous development in order to yield the best
result. Training is most popular method of making employees familiar with important
and new concept necessary for business but providing training alone do not
guarantee the final results one of the main determinant is how employees takes the
training their attitude and perception
Attitude of employees towards training are driven by different factors which
includes the demographic factors, this study is intended to know how demographic
factors influence attitudes of employees towards training. Sample of employees with
different demographic factors is studied and it is seen how these factors results in
difference of attitude in employees.
The study is divided into Six parts. The First part is about the introduction to
study. This part explains the concept of Training, its need, issue, process and result
of a well-executed training and how demographic factors are important variables.
The Second part is about literature review. Certain previous research which was held
in related field was taken into consideration before formulating the research.
Literature review from books, journals, research papers etc were taken. The Third
part contains Background of study, Objectives, Problem statement, Scope,
Hypothesis and Research Methodology. The Forth part consists of data analysis and
interpretation. The data was coded and tabulated in spreadsheet. Statistical tools
have been used in this study. Chi-square test has been applied to analyse the data.
Statistical software (SPSS) has been used for data analysis. The Fifth part contains
Findings, Conclusion and Recommendations of and from the study.
4
Introduction
Training is the one of the most important function of human resource in any
organization. It increases the efficiency and the effectiveness of both employees and
the organization.in this competitive world, training plays an important role in the
competent and challenging format of business. Training is the nerve that suffices the
need of fluent and smooth functioning of work which helps in enhancing the quality of
work life of employees and organizational development too. Every organization
needs to study the role, importance and advantages of training and its positive
Impact on development for the growth of the organization. Quality of work life is a
process in which the organization recognizes their responsibility for excellence of
organizational performance as well as employee skills. Training implies constructive
development in such organizational motives for optimum enhancement of quality of
work life of the employees. These types of training and development programs help
in improving the employee behaviour and attitude towards the job and also uplift their
morale. Thus, employee training and development programs are important aspects
which are needed to be studied and focused on
The man power must be properly recruited, nourished and utilized. Every
organization must have its own human resource policies, procedures, rules,
regulations, strategies and so on. For this purpose the organization must have
separate department called HRD/T&D, which will all the times strive to manage and
develop the human resource in organization. Though there are some studies in this
field, there are some gaps in them. There haven’t been studies which show how the
demographic factors of employees affect their attitude towards different aspects such
as training.
Demographic factors play very important role in sculpturing personality of an
individual that in results in his behaviour and attitude towards different things, little
inquiry was done as to the demographic factors that could determine the strength of
its differential Impact on people from diverse backgrounds. This limitation is evident
in this brief literature review. Given this context, the following could be reviewed as a
humble attempt to contribute to the enlightenment of this subject matter.
Gender : There was a study providing a correlation between gender and level of
learning (Schodt 2005). It was supposed that males, generally, have higher levels of
affect than female students in classroom scenarios where instructors used no
technology, whereas female students reported higher levels initial affect than male
students in classroom scenarios where instructors used moderate amounts of
technology (Schrodt 2005). Nonetheless, is was also observed that across genders,
continued incremental use of technology would eventually lead to a point to
diminishing return.
Age Older people have relatively slower perceptual learning than younger ones
(gilbert 1996). This input could be factored in the designing materials for audiences
of varying ages. Mungania (2003), in his description of the e-learning users, asserted
that middle-aged people account for the great part of the educational approach’s
audience, with 80% of the polled respondents belonging to the lower that 45 years.
5
Level of education In his presentation, Mungania (2003) suggested people who
have a relatively high degree of academic and professional education. In his
backdrop of e-learners, he maintained that 37% are bachelor’s degree holders, 56%
continue studying while in the office, 80% have been enrolled in no less than ten
online courses and that 96% are intermediate and advanced uses of computer
training exposure and that 87% registered warm acceptance of the modern learning
approach
Marital status This have Impact on how employee live outside the organisation,
what are factors that affect decisions of employee other than the work
Designation represents the authority and responsibility of employee determining his
perception on different aspects of job
Knowing this will not only help in designing better training program and yield more
out of it, it will also help at different level right starting from recruitment process.
Although studies are present on training, the information provided by them is not
suitable and sufficient for present context. More over in review of literature some
missing links are observed. So this study is to be conducted to fill the gap and also
add to the existing literature in the field of hr practices.
6
Training
Training aims to achieve behaviour change resulting a change in performance
and improvement in skills which is measurable. Training is not the end itself but a
means to an end. To be effective, training needs to be learner oriented as opposed
to trainer oriented. Its aim is to stimulate and help learners to learn rather than to
impose upon the trainee what the trainer believes should be learnt so the trainer
must use learner oriented techniques. In this chapter basic concepts of learning,
training objectives, needs, methods, advantages and evaluation are discussed to
throw light on training and development since training remains as the most powerful
motivating factor for human system. Training should be viewed as a long term
investment in human resources using the equation.
Performance = ability x motivation
Training has Impact on both the factors. It can improve skills and abilities of
the employees and their motivation by increasing their sense of commitment and
encouraging them to develop and use new skills. It is a powerful tool that can have a
major Impact on both employees’ productivity and morale.
An organisation’s effectiveness depends on its
Ability to accomplish the following three objectives.
I. To achieve its goals.
Ii. To maintain itself internally and
Iii. To adapt to its environment.
Issues In Training
The following are the objectives of training programmes.
 To prepare employees for the job meant for them on first
Appointment/promotion/transfer and impart to them the required skill and
knowledge.
 To assist employees to function more effectively in their present position
by exposing them to the latest concepts/information/ technologies and
develop skills that would be required in their particular fields.
 To build a second line competent officers and prepare them to occupy
more responsible positions.
 Training must be based on ogranisation and individual needs.
 Training should address problems that need to be solved.
 Training should be based on sound theories of learning.
 Training should be evaluated periodically and make modifications in the
Training programmes whenever necessary.
 Training should be a continuous process for employees.
7
Need For Training
Training is needed for the following reasons
 New incumbents and inexperienced employees require training for
Effective performance on the job
 Employees not only to work but work more effectively with minimum
Supervision, minimum cost, less waste and produce good quality
Services.
 Increasing use of fast changing techniques in production and other
Operations require training into new methods for the operatives.
 Experienced employees need refresher training to enable them to keep
Abreast of changing techniques and the use of sophisticated tools and
Equipments.
 Training is necessary when a person has to move from one job to another
because of promotion / transfer.
Stages of Training and Development Programs
Training should be conducted in a systematic order so as to derive expected
benefits from it. The training system involves four stages, namely: a. Assessment of
training and development programs needs. B. Designing the training and
development programs. C. Implementation of the training program d. Evaluation of
the training program stages in training and development programs
(source: p. Subba Rao, “essentials of human resource management and industrial
relations” Himalaya publication house, 3rd revised & enlarged edition 2009, pg-199-
203)
A WELL-PLANNED AND WELL-EXECUTED TRAINING PROGRAMME SHOULD RESULT IN :-
1) Reduction in waste and spoilage;
2) Reduction in manpower obsolescence;
3) Reduction in learning time;
4) Reduction in supervisory burden;
5) Reduction in machine breakage and maintenance cost;
6) Reduction in accident rate;
8
7) Improvement in methods of word
8) Improvement in quality of products;
9) Improvement in production rate;
10)Improvement of morale and reduction in grievances;
11)Improvement of efficiency and productivity;
12)Enabling the organisation to provide increased financial incentives, opportunity
for internal
13)Promotion and raising of pay rates;
14)Wider awareness among participants, enlarged skill; and personal growth.
9
Research
Objectives
Primary
 To study how different demographic factor influence attitude of employees
towards training Program
 To offer suggestions and recommendations for more effective design of
training program
Secondary
 To assign perception of employees sharing same demographic factor
 To study whether employees with different demographic factors differ in their
attitude
 To make present training program more effective
 To direct attitude of employees in right direction
 To redesign training programs
 To associate employees personal factors like age, experience and education
and the employee’s attitude on training.
Background of study
 Employees recruited for company rarely 100% fits in job description and
job specification
 In order to match the present knowledge skills and ability of employees to
that of required, training is imparted
 Training increases the job performance of employees and help
organisation to grow more.
 Many factors contribute towards formation of attitude of an employee
 Demographic factors play huge role in determining the attitude of
employees
 Attitude of employees determines how he is/will perceive anything
Hence it is important to see if demographic factors play part in formation of
attitude toward training.
Problem Statement
“Impact of Demographic Factors on Employees’ Attitude towards Training Program”
.
1. Does demographic factors influence attitude of employees?
2. Does demographic factor of employees affect how they perceive training?
3. How attitude of employees determines success of training program ?
10
4. How does demographic factor influence attitude of employees towards training ?
5. How does attitude of employees differs as per difference in their demographic
background?
Scope
Study was conducted on 100 employees of ONGC Ahmedabad on the basis
of training that they have gone through and their attitude towards that training(s).
Demographic factors to be studied are their,
-Age,
-Gender,
-Marital Status,
-Education and
-Designation
In the company and their Impact on attitude factor of employees, toward training,
such as
- Importance of training,
-Training programs hours per day
-Duration of a whole training program
-Interval between Training Programs
- Location of training Program
11
RDF/
Hypothesis
H0 – there is no significant Impact of demographic factor on attitude of employees
towards training
H1 – there is significant Impact of demographic factor on attitude of employees
towards training
H2: there is a significant relationship between gender and perceiving training
H3: there is a significant relationship between marital status and perceiving training
H4: there is significant relationship between age and perceiving training
H5: there is significant relationship between level of education and perceiving
training
H6: there is significant relationship between designation and perceiving training
Research Methodology
This study is primary data based involves to explored the effect of
demographic factors on attitude towards training program. Data is collected from
Attitude towards Training
Program Factors
- Importance of training,
-Training programs hours per
day
-Duration of a whole training
program
-Interval between Training
Programs
- Location of training
Program
AGE
GENDER
EDUCATIONAL LEVEL
MARITAL STATUS
DESIGNATION
12
various respondents through a structured questionnaire. The Questionnaire contains
close ended questions. The total sample consisted of 100 respondents. Males and
females from different occupations and income levels are splits from different age
groups and education levels. In this study attitude towards training program is
consider as a dependent variable, while demographic factors individually checked as
independent factors in relation with attitude of investors. In order to statistically check
the results Chi- square test is used. These tests are also used by Jain, D.D. &
Mandot, M.N. (2012) for similar study in Rajasthan. In The Effect of Demographic
Factors on the Behaviour of Investors during the Choice of Investment. The data
statistical package SPSS is used.
Sampling unit:
The sampling unit consisted of 100 employees with different demographical
background.
Study population:
Employees of different companies
Sampling method:
Since the study focuses on perception of different employees towards similar
training, the appropriate sampling technique followed was non-probabilistic sampling
technique i.e. Convenience sampling method.
Sample size:
Formula ; n = p*q*(z/e)2
Pre testing = 14 people
positive response = 13 people = 92.8%
value of p = .928 = .93
value of q= .070
Here p=.93
q=.07
(z/e)2
= 1536.69
Therefore n= .93 x .07 x 1536.69
n= 100.03
Hence sample size was taken as 100 people
Statistical Tests
The statistical measure used to analyse the data was Pearson’s Chi-Square
test, the most commonly used type of Chi-square significance test. When wanting to
know if “frequency of cases possessing some quality varies among levels of a given
factor or among combinations of levels of two or more factors” a chi-square test is
13
appropriate (Preacher, 2001). The main goal of a chi-square test is to show whether
there are significant differences between the populations being tested (Gravetter &
Wallnau, 2009, p. 619). “To conduct the chi-square test, the researcher enters
observed frequencies corresponding to combinations of levels of relevant
factors…sums of elements within rows and within columns are then computed”
(Preacher, 2001). A chi-square test is more likely to establish significance if “(1) the
relationship is strong, (2) the sample size is large, and/or (3) the number of values of
the two associated variables is large” (North Carolina State University, 2009). The
results of a chi-square test will usually be reported in a table that shows either the
number or percentage of responses or cases in each category (McMillan, 2008, p.
266). “If the number is less than five in any single category, the chi-square test
needs to be “corrected” with, what is called, a Yate’s correction. This correction
statistically adjusts the numbers to get a more valid result”
Table 1: Demographic characteristics of the respondents
Characteristics of respondents No of
respondents
Percentage (%)
Age 25-32 34 34
33-40 33 33
41+ 33 33
Total 100 100
Gender Male 70 70
Female 30 30
Total 100 100
Education Low level (matrix-iti) 46 46
High level (grad-post grad) 54 54
Total 100 100
Marital status Married 66 66
Unmarried 34 34
Total 100 100
Designation Bottom level (wi – av) 21 21
Middle level (si – s iv) 33 33
Top level (e0 +) 46 46
Total 100 100
14
From the above table it is seen that ;
 Percentage of respondents of different age group are 25 to 50 (young
to old) are relatively same.
 Percentage of male respondents is more than female respondents
which are 70 and 30 respectively.
 Percentage of respondents with high level education is more than that
of low level education which are 54 and 46 respectively.
 Percentages of respondents who are married are more than that of
unmarried respondents which are 66 and 34 respectively.
 21% respondents are at bottom level, 33% respondents are at middle
level and 46% respondents are at top level in hierarchy of business.
15
Analysis
IMPORTANCE OF TRAINING
Age wise
H0 – There is no significance impact of Age on Attitude of employees towards
Importance of training
H1 – There is significance impact of Age on Attitude of employees towards
Importance of training
(T 1.1) Importance * age crosstabulation
Age
TotalYoung
Middle
age Old age
Importanc
e
Strongly
disagree
Count 0 6 2 8
Expected
count
2.7 2.6 2.6 8.0
Disagree Count 6 4 2 12
Expected
count
4.1 4.0 4.0 12.0
Neutral Count 4 5 1 10
Expected
count
3.4 3.3 3.3 10.0
Agree Count 16 14 24 54
Expected
count
18.4 17.8 17.8 54.0
Strongly agree Count 8 4 4 16
Expected
count
5.4 5.3 5.3 16.0
Total Count 34 33 33 100
Expected
count
34.0 33.0 33.0 100.0
16
(C 1.1)Chi-square tests
Value Df
Asymptotic
significance
(2-sided)
Pearson chi-square 16.701a
8 .033
N of valid cases 100
A. 9 cells (60.0%) have expected count less than 5.
The minimum expected count is 2.64.
Calculated value of Chi-square is 16.701. Chi-square at 5% Significance Level and 8
Degree of Freedom with p = .033. As the calculated value of p is less than the critical
value .05, Null hypothesis is rejected and alternative hypothesis is accepted,
revealing that There Is Significant Impact Of Employee’s Age On Their Attitude
Towards Importance Of Training.
Gender
H0 – There is no significance impact of Gender on Attitude of employees towards
Importance of training
H1 – There is significance impact of Gender on Attitude of employees towards
Importance of training
(T1.2) Importance * gender Cross tabulation
Gender
TotalMale Female
Importanc
e
Strongly
disagree
Count 5 3 8
Expected
count
5.6 2.4 8.0
Disagree Count 8 4 12
Expected
count
8.4 3.6 12.0
Neutral Count 4 6 10
17
Expected
count
7.0 3.0 10.0
Agree Count 41 13 54
Expected
count
37.8 16.2 54.0
Strongly agree Count 12 4 16
Expected
count
11.2 4.8 16.0
Total Count 70 30 100
Expected
count
70.0 30.0 100.0
(C 1.2)Chi-square tests
Value Df
Asymptotic
significance
(2-sided)
Pearson chi-square 5.657a
4 .226
N of valid cases 100
A. 4 cells (40.0%) have expected count less than 5.
The minimum expected count is 2.40.
Calculated value of Chi-square is 5.657. Chi-square at 5% Significance Level and 4
Degree of Freedom with p = .226. As the calculated value of p is more than the
critical value .05, Null hypothesis is accepted and alternative hypothesis is rejected,
revealing that There Is No Significant Impact Of Gender Of Employees On Their
Attitude Towards Importance Of Training.
Educational level
H0 – There is no significance impact of Educational Level on Attitude of employees
towards Importance of training
H1 – There is significance impact of Educational Level on Attitude of employees
towards Importance of training
18
(T1.3) Importance * education level Cross tabulation
Education level
TotalLow High
Importanc
e
Strongly
disagree
Count 5 3 8
Expected
count
3.7 4.3 8.0
Disagree Count 8 4 12
Expected
count
5.5 6.5 12.0
Neutral Count 5 5 10
Expected
count
4.6 5.4 10.0
Agree Count 18 36 54
Expected
count
24.8 29.2 54.0
Strongly agree Count 10 6 16
Expected
count
7.4 8.6 16.0
Total Count 46 54 100
Expected
count
46.0 54.0 100.0
(C1.3) Chi-square tests
Value Df
Asymptotic
significance
(2-sided)
Pearson chi-square 8.246a
4 .083
N of valid cases 100
A. 3 cells (30.0%) have expected count less than 5.
The minimum expected count is 3.68.
19
Calculated value of Chi-square is 8.246. Chi-square at 5% Significance Level and 4
Degree of Freedom with p = .083. As the calculated value of p is more than the
critical value .05, Null hypothesis is accepted and alternative hypothesis is rejected,
revealing that There Is No Significance Impact Of Educational Level On Attitude
Of Employees Towards Importance Of Training
Marital status
H0 – There is no significance impact of Marital Status on Attitude of employees
towards Importance of training
H1 – There is significance impact of Marital Status on Attitude of employees towards
Importance of training
(T1.4) Importance * marital status cross tabulation
Marital status
TotalMarried
Unmarrie
d
Importanc
e
Strongly
disagree
Count 5 3 8
Expected
count
5.3 2.7 8.0
Disagree Count 7 5 12
Expected
count
7.9 4.1 12.0
Neutral Count 2 8 10
Expected
count
6.6 3.4 10.0
Agree Count 39 15 54
Expected
count
35.6 18.4 54.0
Strongly agree Count 13 3 16
Expected
count
10.6 5.4 16.0
Total Count 66 34 100
Expected
count
66.0 34.0 100.0
20
(C 1.4) Chi-square tests
Value Df
Asymptotic
significance
(2-sided)
Pearson chi-square 12.377a
4 .015
N of valid cases 100
A. 3 cells (30.0%) have expected count less than 5.
The minimum expected count is 2.72.
Calculated value of Chi-square is 12.377. Chi-square at 5% Significance Level and 4
Degree of Freedom with p = .015. As the calculated value of p is less than the critical
value .05, Null hypothesis is rejected and alternative hypothesis is accepted,
revealing that There Is Significance Impact Of Marital Status On Attitude Of
Employees Towards Importance Of Training
Designation
H0 – There is no significance impact of Designation Level on Attitude of employees
towards Importance of training
H1 – There is significance impact of Designation Level on Attitude of employees
towards Importance of training
(T1.5) Importance * designation level cross tabulation
Designation level
TotalBottom Middle Top
Importanc
e
Strongly
disagree
Count 3 2 3 8
Expected
count
1.7 2.6 3.7 8.0
Disagree Count 6 3 3 12
Expected
count
2.5 4.0 5.5 12.0
Neutral Count 3 4 3 10
Expected
count
2.1 3.3 4.6 10.0
Agree Count 5 20 29 54
Expected
count
11.3 17.8 24.8 54.0
21
Strongly agree Count 4 4 8 16
Expected
count
3.4 5.3 7.4 16.0
Total Count 21 33 46 100
Expected
count
21.0 33.0 46.0 100.0
(C 1.5)Chi-square tests
Value Df
Asymptotic
significance
(2-sided)
Pearson chi-square 13.593a
8 .093
N of valid cases 100
A. 9 cells (60.0%) have expected count less than 5. The minimum
expected count is 1.68.
Calculated value of Chi-square is 13.593. Chi-square at 5% Significance Level and 8
Degree of Freedom with p = .093. As the calculated value of p is more than the
critical value .05, Null hypothesis is accepted and alternative hypothesis is rejected,
revealing that there is no significance impact of Designation Level on Attitude
of employees towards Importance of training
22
TRAINING HOURS PER DAY :
Age wise
H0 – There is no significance impact of Age on Attitude of employees towards
training hours per day
H1 – There is significance impact of Age on Attitude of employees towards training
hours per day
(T 2.1)Training hours per day * age cross tabulation
Age
TotalYoung
Middle
age Old age
Training hours per
day
Strongly
disagree
Count 2 3 7 12
Expected
count
4.1 4.0 4.0 12.0
Disagree Count 5 18 11 34
Expected
count
11.6 11.2 11.2 34.0
Neutral Count 4 3 5 12
Expected
count
4.1 4.0 4.0 12.0
Agree Count 19 5 8 32
Expected
count
10.9 10.6 10.6 32.0
Strongly agree Count 4 4 2 10
Expected
count
3.4 3.3 3.3 10.0
Total Count 34 33 33 100
Expected
count
34.0 33.0 33.0 100.0
23
(C2.1)Chi-square tests
Value Df
Asymptotic
significance
(2-sided)
Pearson chi-square 22.333a
8 .004
Likelihood ratio 22.268 8 .004
Linear-by-linear
association
9.279 1 .002
N of valid cases 100
A. 9 cells (60.0%) have expected count less than 5.
The minimum expected count is 3.30.
Calculated value of Chi-square is 22.333. Chi-square at 5% Significance Level and 8
Degree of Freedom with p = .004. As the calculated value of p is less than the critical
value .05, Null hypothesis is rejected and alternative hypothesis is accepted,
revealing that there is significance impact of Age on Attitude of employees
towards training hours per day
Gender
H0 – There is no significance impact of Gender on Attitude of employees towards
Training Hours per Day
H1 – There is significance impact of Gender on Attitude of employees towards
Training Hours per Day
(T 2.2) Training hours per day * gender cross tabulation
Gender
TotalMale Female
Training hours per
day
Strongly
disagree
Count 6 6 12
Expected
count
8.4 3.6 12.0
Disagree Count 20 14 34
Expected
count
23.8 10.2 34.0
Neutral Count 8 4 12
Expected
count
8.4 3.6 12.0
Agree Count 27 5 32
Expected
count
22.4 9.6 32.0
24
Strongly agree Count 9 1 10
Expected
count
7.0 3.0 10.0
Total Count 70 30 100
Expected
count
70.0 30.0 100.0
(C2.2)Chi-square tests
Value Df
Asymptotic
significance
(2-sided)
Pearson chi-square 9.425a
4 .049
Likelihood ratio 9.952 4 .041
Linear-by-linear
association
9.078 1 .003
N of valid cases 100
A. 3 cells (30.0%) have expected count less than 5.
The minimum expected count is 3.00.
Calculated value of Chi-square is 9.425 . Chi-square at 5% Significance Level and 8
Degree of Freedom with p =.049 As the calculated value of p is less than the critical
value .05, Null hypothesis is rejected and alternative hypothesis is accepted,
revealing that there is significance impact of Gender on Attitude of employees
towards Training Hours per Day
Educational level
H0 – There is no significance impact of Educational Level on Attitude of employees
towards Training Hours per Day
H1 – There is significance impact of Educational Level on Attitude of employees
towards Training Hours per Day
25
(T2.3)Training hours per day * education level cross tabulation
Education level
TotalLow High
Training hours per
day
Strongly
disagree
Count 5 7 12
Expected
count
5.3 6.7 12.0
Disagree Count 9 25 34
Expected
count
15.0 19.0 34.0
Neutral Count 8 4 12
Expected
count
5.3 6.7 12.0
Agree Count 18 14 32
Expected
count
14.1 17.9 32.0
Strongly agree Count 4 6 10
Expected
count
4.4 5.6 10.0
Total Count 44 56 100
Expected
count
44.0 56.0 100.0
(C2.3)Chi-square tests
Value Df
Asymptotic
significance
(2-sided)
Pearson chi-square 8.783a
4 .067
N of valid cases 100
A. 1 cells (10.0%) have expected count less than 5.
The minimum expected count is 4.40.
Calculated value of Chi-square is 8.783. Chi-square at 5% Significance Level and 4
Degree of Freedom with p = .067. As the calculated value of p is more than the
critical value .05, Null hypothesis is accepted and alternative hypothesis is rejected,
revealing that there is significance impact of Educational Level on Attitude of
employees towards Training Hours per Day.
26
Marital status
H0 – There is no significance impact of Marital Status on Attitude of employees
towards Training Hours per Day
H1 – There is significance impact of Marital Status on Attitude of employees towards
Training Hours per Day
(T2.4)Training hours per day * marital status cross tabulation
Marital status
TotalMarried
Unmarrie
d
Training hours per
day
Strongly
disagree
Count 10 2 12
Expected
count
7.9 4.1 12.0
Disagree Count 31 3 34
Expected
count
22.4 11.6 34.0
Neutral Count 9 3 12
Expected
count
7.9 4.1 12.0
Agree Count 12 20 32
Expected
count
21.1 10.9 32.0
Strongly agree Count 4 6 10
Expected
count
6.6 3.4 10.0
Total Count 66 34 100
Expected
count
66.0 34.0 100.0
27
(C2.4)Chi-square tests
Value Df
Asymptotic
significance
(2-sided)
Pearson chi-square 26.239a
4 .001
N of valid cases 100
A. 3 cells (30.0%) have expected count less than 5.
The minimum expected count is 3.40.
Calculated value of Chi-square is 26.239 . Chi-square at 5% Significance Level and
4 Degree of Freedom with p =001 . . As the calculated value of p is less than the
critical value .05, Null hypothesis is rejected and alternative hypothesis is accepted ,
revealing that there is significance impact of Marital Status on Attitude of
employees towards Training Hours per Day
Designation
H0 – There is no significance impact of Designation Level on Attitude of employees
towards Training Hours per Day
H1 – There is significance impact of Designation Level on Attitude of employees
towards Training Hours per Day
(T2.5)Training hours per day * designation level crosstabulation
Designation level
TotalBottom Middle Top
Training hours per
day
Strongly
disagree
Count 4 3 5 12
Expected
count
2.5 4.0 5.5 12.0
Disagree Count 6 11 17 34
Expected
count
7.1 11.2 15.6 34.0
Neutral Count 4 4 4 12
Expected
count
2.5 4.0 5.5 12.0
Agree Count 4 12 16 32
Expected
count
6.7 10.6 14.7 32.0
28
Strongly agree Count 3 3 4 10
Expected
count
2.1 3.3 4.6 10.0
Total Count 21 33 46 100
Expected
count
21.0 33.0 46.0 100.0
(C2.5)Chi-square tests
Value Df
Asymptotic
significance
(2-sided)
Pearson chi-square 4.644a
8 .795
N of valid cases 100
A. 7 cells (46.7%) have expected count less than 5.
The minimum expected count is 2.10.
Calculated value of Chi-square is 4.644. Chi-square at 5% Significance Level and 8
Degree of Freedom with p = .795. As the calculated value of p is more than the
critical value .05, Null hypothesis is accepted and alternative hypothesis is rejected,
revealing that there is no significance impact of Designation Level on Attitude
of employees towards Training Hours per Day
29
NUMBER OF TRAINING DAYS PER PROGRAM :
Age wise
H0 – There is no significance impact of Age on Attitude of employees towards
Number of Training Days
H1 – There is significance impact of Age on Attitude of employees towards Number
of Training Days
(T 3.1)Long training program * age crosstabulation
Age
TotalYoung
Middle
age Old age
Long training
program
Strongly
disagree
Count 3 4 7 14
Expected
count
4.8 4.6 4.6 14.0
Disagree Count 6 15 14 35
Expected
count
11.9 11.6 11.6 35.0
Neutral Count 4 6 7 17
Expected
count
5.8 5.6 5.6 17.0
Agree Count 16 6 4 26
Expected
count
8.8 8.6 8.6 26.0
Strongly agree Count 5 2 1 8
Expected
count
2.7 2.6 2.6 8.0
Total Count 34 33 33 100
Expected
count
34.0 33.0 33.0 100.0
30
(C 3.1)Chi-square tests
Value Df
Asymptotic
significance
(2-sided)
Pearson chi-square 19.460a
8 .013
Likelihood ratio 19.490 8 .012
Linear-by-linear
association
13.401 1 .000
N of valid cases 100
A. 6 cells (40.0%) have expected count less than 5.
The minimum expected count is 2.64.
Calculated value of Chi-square is 19.460 . Chi-square at 5% Significance Level and
8 Degree of Freedom with p = .013 . As the calculated value of p is less than the
critical value .05, Null hypothesis is rejected and alternative hypothesis is accepted ,
revealing that there is significance impact of Age on Attitude of employees
towards Number of Training Days
Gender
H0 – There is no significance impact of Gender on Attitude of employees towards
Number of Training Days
H1 – There is significance impact of Gender on Attitude of employees towards
Number of Training Days
(T 3.2)Long training program * gender crosstabulation
Gender
TotalMale Female
Long training
program
Strongly
disagree
Count 9 5 14
Expected
count
9.5 4.5 14.0
Disagree Count 20 15 35
Expected
count
23.8 11.2 35.0
Neutral Count 10 7 17
Expected
count
11.6 5.4 17.0
Agree Count 23 3 26
Expected
count
17.7 8.3 26.0
31
Strongly agree Count 6 2 8
Expected
count
5.4 2.6 8.0
Total Count 68 32 100
Expected
count
68.0 32.0 100.0
(C 3.2)Chi-square tests
Value Df
Asymptotic
significance
(2-sided)
Pearson chi-square 7.825a
4 .098
Likelihood ratio 8.692 4 .069
Linear-by-linear
association
4.004 1 .045
N of valid cases 100
A. 2 cells (20.0%) have expected count less than 5.
The minimum expected count is 2.56.
Calculated value of Chi-square is 7.825 . Chi-square at 5% Significance Level and 8
Degree of Freedom with p = .098 . As the calculated value of p is more than the
critical value .05, Null hypothesis is accepted and alternative hypothesis is rejected,
revealing that there is no significance impact of Gender on Attitude of
employees towards Number of Training Days.
Educational level
H0 – There is no significance impact of Educational Level on Attitude of employees
towards Number of Training Days
H1 – There is significance impact of Educational Level on Attitude of employees
towards Number of Training Days
(T 3.3)Long training program * education level crosstabulation
Education level
TotalLow High
Long training Strongly Count 11 3 14
32
program disagree Expected
count
6.4 7.6 14.0
Disagree Count 14 21 35
Expected
count
16.1 18.9 35.0
Neutral Count 7 10 17
Expected
count
7.8 9.2 17.0
Agree Count 11 15 26
Expected
count
12.0 14.0 26.0
Strongly agree Count 3 5 8
Expected
count
3.7 4.3 8.0
Total Count 46 54 100
Expected
count
46.0 54.0 100.0
(C3.3)Chi-square tests
Value Df
Asymptotic
significance
(2-sided)
Pearson chi-square 7.021a
4 .135
N of valid cases 100
A. 2 cells (20.0%) have expected count less than 5.
The minimum expected count is 3.68.
Calculated value of Chi-square is 7.021 . Chi-square at 5% Significance Level and 4
Degree of Freedom with p = .135 . As the calculated value of p is more than the
critical value .05, Null hypothesis is accepted and alternative hypothesis is rejected,
revealing that there is no significance impact of Educational Level on Attitude
of employees towards Number of Training Days
33
Marital status
H0 – There is no significance impact of Marital Status on Attitude of employees
towards Number of Training Days
H1 – There is significance impact of Marital Status on Attitude of employees towards
Number of Training Days
(T 3.4) Long training program * marital status crosstabulation
Marital status
TotalMarried
Unmarrie
d
Long training
program
Strongly
disagree
Count 11 3 14
Expected
count
9.2 4.8 14.0
Disagree Count 30 5 35
Expected
count
23.1 11.9 35.0
Neutral Count 10 7 17
Expected
count
11.2 5.8 17.0
Agree Count 12 14 26
Expected
count
17.2 8.8 26.0
Strongly agree Count 3 5 8
Expected
count
5.3 2.7 8.0
Total Count 66 34 100
Expected
count
66.0 34.0 100.0
34
(C3.4)Chi-square tests
Value Df
Asymptotic
significance
(2-sided)
Pearson chi-square 14.897a
4 .005
N of valid cases 100
A. 2 cells (20.0%) have expected count less than 5.
The minimum expected count is 2.72.
Calculated value of Chi-square is 14.897 . Chi-square at 5% Significance Level and
4 Degree of Freedom with p =005 . . As the calculated value of p is less than the
critical value .05, Null hypothesis is rejected and alternative hypothesis is accepted,
revealing that there is significance impact of Marital Status on Attitude of
employees towards Number of Training Days
Designation
H0 – There is no significance impact of Designation Level on Attitude of employees
towards Number of Training Days
H1 – There is significance impact of Designation Level on Attitude of employees
towards Number of Training Days
(T3.5)Long training program * designation level cross tabulation
Designation level
TotalBottom Middle Top
Long training
program
Strongly
disagree
Count 3 7 4 14
Expected
count
2.9 4.6 6.4 14.0
Disagree Count 9 13 13 35
Expected
count
7.4 11.6 16.1 35.0
Neutral Count 2 5 10 17
Expected
count
3.6 5.6 7.8 17.0
Agree Count 5 6 15 26
35
Expected
count
5.5 8.6 12.0 26.0
Strongly agree Count 2 2 4 8
Expected
count
1.7 2.6 3.7 8.0
Total Count 21 33 46 100
Expected
count
21.0 33.0 46.0 100.0
(C3.5)Chi-square tests
Value Df
Asymptotic
significance
(2-sided)
Pearson chi-square 6.497a
8 .592
Likelihood ratio 6.614 8 .579
Linear-by-linear
association
1.979 1 .160
N of valid cases 100
A. 6 cells (40.0%) have expected count less than 5. The minimum
expected count is 1.68.
Calculated value of Chi-square is 6.496. Chi-square at 5% Significance Level and 8
Degree of Freedom with p =592 . . As the calculated value of p is more less than the
critical value .05, Null hypothesis is accepted rejected and alternative hypothesis is
accepted rejected, revealing that there is no significance impact of Designation
Level on Attitude of employees towards Number of Training Days
36
INTERVAL BETWEEN TWO TRAINING PROGRAMS :
Age wise
H0 – There is no significance impact of Age on Attitude of employees towards
Interval Between training Programs
H1 – There is significance impact of Age on Attitude of employees towards Interval
Between training Programs
(T 4.1)Intervals * age crosstabulation
Age
TotalYoung
Middle
age Old age
Interval
s
Strongly
disagree
Count 3 4 9 16
Expected
count
5.4 5.3 5.3 16.0
Disagree Count 4 13 12 29
Expected
count
9.9 9.6 9.6 29.0
Neutral Count 4 6 4 14
Expected
count
4.8 4.6 4.6 14.0
Agree Count 14 8 5 27
Expected
count
9.2 8.9 8.9 27.0
Strongly agree Count 9 2 3 14
Expected
count
4.8 4.6 4.6 14.0
Total Count 34 33 33 100
Expected
count
34.0 33.0 33.0 100.0
37
(C 4.1)Chi-square tests
Value Df
Asymptotic
significance
(2-sided)
Pearson chi-square 20.142a
8 .010
Likelihood ratio 20.418 8 .009
Linear-by-linear
association
14.185 1 .000
N of valid cases 100
A. 6 cells (40.0%) have expected count less than 5.
The minimum expected count is 4.62.
Calculated value of Chi-square is 20.142 . Chi-square at 5% Significance Level and
8 Degree of Freedom with p = .010 . As the calculated value of p is less than the
critical value .05, Null hypothesis is rejected and alternative hypothesis is accepted ,
revealing that there is significance impact of Age on Attitude of employees
towards Intervals between trainings.
Gender
H0 – There is no significance impact of Gender on Attitude of employees towards
Interval Between training Programs
H1 – There is significance impact of Gender on Attitude of employees towards
Interval Between training Programs
(T 4.2)Intervals * gender crosstabulation
Gender
TotalMale Female
Interval
s
Strongly
disagree
Count 9 7 16
Expected
count
11.2 4.8 16.0
Disagree Count 15 14 29
Expected
count
20.3 8.7 29.0
Neutral Count 12 2 14
Expected
count
9.8 4.2 14.0
Agree Count 21 6 27
Expected
count
18.9 8.1 27.0
38
Strongly agree Count 13 1 14
Expected
count
9.8 4.2 14.0
Total Count 70 30 100
Expected
count
70.0 30.0 100.0
( C 4.2)Chi-square tests
Value Df
Asymptotic
significance
(2-sided)
Pearson chi-square 11.960a
4 .018
Likelihood ratio 12.782 4 .012
Linear-by-linear
association
8.891 1 .003
N of valid cases 100
A. 3 cells (30.0%) have expected count less than 5.
The minimum expected count is 4.20.
Calculated value of Chi-square is 11.960 . Chi-square at 5% Significance Level and
4 Degree of Freedom with p = .018 . As the calculated value of p is less than the
critical value .05, Null hypothesis is rejected and alternative hypothesis is accepted ,
revealing that there is significance impact of Gender on Attitude of employees
towards Intervals between trainings.
Educational level
H0 – There is no significance impact of Educational Level on Attitude of employees
towards Interval Between training Programs
H1 – There is significance impact of Educational Level on Attitude of employees
towards Interval Between training Programs
39
(T 4.3)Intervals * education level crosstabulation
Education level
TotalLow High
Interval
s
Strongly
disagree
Count 6 10 16
Expected
count
7.4 8.6 16.0
Disagree Count 13 16 29
Expected
count
13.3 15.7 29.0
Neutral Count 7 7 14
Expected
count
6.4 7.6 14.0
Agree Count 13 14 27
Expected
count
12.4 14.6 27.0
Strongly agree Count 7 7 14
Expected
count
6.4 7.6 14.0
Total Count 46 54 100
Expected
count
46.0 54.0 100.0
(C 4.3)Chi-square tests
Value Df
Asymptotic
significance
(2-sided)
Pearson chi-square .712a
4 .950
N of valid cases 100
A. 0 cells (.0%) have expected count less than 5. The
minimum expected count is 6.44.
Calculated value of Chi-square is .712 . Chi-square at 5% Significance Level and 8
Degree of Freedom with p = .950 . As the calculated value of p is more than the
critical value .05, Null hypothesis is accepted and alternative hypothesis is rejected ,
revealing that there is no significance impact of Educational Level on Attitude
of employees towards Intervals between trainings.
40
Marital status
H0 – There is no significance impact of Marital Status on Attitude of employees
towards Interval Between training Programs
H1 – There is significance impact of Marital Status on Attitude of employees towards
Interval Between training Programs
(T 4.4)Intervals * marital status crosstabulation
Marital status
TotalMarried
Unmarrie
d
Interval
s
Strongly
disagree
Count 12 4 16
Expected
count
10.6 5.4 16.0
Disagree Count 20 9 29
Expected
count
19.1 9.9 29.0
Neutral Count 12 2 14
Expected
count
9.2 4.8 14.0
Agree Count 14 13 27
Expected
count
17.8 9.2 27.0
Strongly agree Count 8 6 14
Expected
count
9.2 4.8 14.0
Total Count 66 34 100
Expected
count
66.0 34.0 100.0
41
(C 4.4)Chi-square tests
Value Df
Asymptotic
significance
(2-sided)
Pearson chi-square 6.014a
4 .198
N of valid cases 100
A. 2 cells (20.0%) have expected count less than 5.
The minimum expected count is 4.76.
Calculated value of Chi-square is 6.014 . Chi-square at 5% Significance Level and 4
Degree of Freedom with p = .198 . As the calculated value of p is more than the
critical value .05, Null hypothesis is accepted and alternative hypothesis is rejected,
revealing that there is no significance impact of Marital Status on Attitude of
employees towards Intervals between trainings.
Designation
H0 – There is no significance impact of Designation Level on Attitude of employees
towards Interval Between training Programs
H1 – There is significance impact of Designation Level on Attitude of employees
towards Interval Between training Programs
(T 4.5)Intervals * designation level crosstabulation
Designation level
TotalBottom Middle Top
Interval
s
Strongly
disagree
Count 4 4 8 16
Expected
count
3.4 5.3 7.4 16.0
Disagree Count 8 5 16 29
Expected
count
6.1 9.6 13.3 29.0
Neutral Count 3 5 6 14
Expected
count
2.9 4.6 6.4 14.0
Agree Count 4 12 11 27
42
Expected
count
5.7 8.9 12.4 27.0
Strongly agree Count 2 7 5 14
Expected
count
2.9 4.6 6.4 14.0
Total Count 21 33 46 100
Expected
count
21.0 33.0 46.0 100.0
(C 4.5)Chi-square tests
Value Df
Asymptotic
significance
(2-sided)
Pearson chi-square 7.437a
8 .490
N of valid cases 100
A. 5 cells (33.3%) have expected count less than 5.
The minimum expected count is 2.94.
Calculated value of Chi-square is 7.437 . Chi-square at 5% Significance Level and 8
Degree of Freedom with p = .490 . As the calculated value of p is more than the
critical value .05, Null hypothesis is accepted and alternative hypothesis is rejected ,
revealing that there is no significance impact of Designation Level on Attitude
of employees towards Intervals between trainings.
Age wise
H0 – There is no significance impact of Age on Attitude of employees towards
Location of Training Program
H1 – There is significance impact of Age on Attitude of employees towards Location
of Training Program
43
(T 5.1) Location * age crosstabulation
Age
TotalYoung
Middle
age Old age
Locatio
n
Strongly
disagree
Count 3 5 9 17
Expected
count
5.8 5.6 5.6 17.0
Disagree Count 5 9 9 23
Expected
count
7.8 7.6 7.6 23.0
Neutral Count 0 4 4 8
Expected
count
2.7 2.6 2.6 8.0
Agree Count 15 15 8 38
Expected
count
12.9 12.5 12.5 38.0
Strongly agree Count 11 0 3 14
Expected
count
4.8 4.6 4.6 14.0
Total Count 34 33 33 100
Expected
count
34.0 33.0 33.0 100.0
(C 5.1) Chi-square tests
Value Df
Asymptotic
significance
(2-sided)
Pearson chi-square 24.943a
8 .002
N of valid cases 100
A. 6 cells (40.0%) have expected count less than 5.
The minimum expected count is 2.64.
Calculated value of Chi-square is 24.943 . Chi-square at 5% Significance Level and
8 Degree of Freedom with p = .002 . As the calculated value of p is less than the
critical value .05, Null hypothesis is rejected and alternative hypothesis is accepted ,
revealing that there is significance impact of Age on Attitude of employees
towards Location Of Training Program
44
Gender
H0 – There is no significance impact of Gender on Attitude of employees towards
Location of Training Program
H1 – There is significance impact of Gender on Attitude of employees towards
Location of Training Program
(T 5.2) Location * gender crosstabulation
Gender
TotalMale Female
Locatio
n
Strongly
disagree
Count 8 9 17
Expected
count
11.9 5.1 17.0
Disagree Count 13 10 23
Expected
count
16.1 6.9 23.0
Neutral Count 5 3 8
Expected
count
5.6 2.4 8.0
Agree Count 30 8 38
Expected
count
26.6 11.4 38.0
Strongly agree Count 14 0 14
Expected
count
9.8 4.2 14.0
Total Count 70 30 100
Expected
count
70.0 30.0 100.0
(C 5.2) Chi-square tests
Value Df
Asymptotic
significance
(2-sided)
Pearson chi-square 13.913a
4 .008
N of valid cases 100
A. 2 cells (20.0%) have expected count less than 5.
The minimum expected count is 2.40.
45
Calculated value of Chi-square is 13.913 . Chi-square at 5% Significance Level and
8 Degree of Freedom with p = .008 . As the calculated value of p is less than the
critical value .05, Null hypothesis is rejected and alternative hypothesis is accepted ,
revealing that there is significance impact of Gender on Attitude of employees
towards Location Of Training Program
Educational level
H0 – There is no significance impact of Educational Level on Attitude of employees
towards Location of Training Program
H1 – There is significance impact of Educational Level on Attitude of employees
towards Location of Training Program
(T 5.3) Location * education level crosstabulation
Education level
TotalLow High
Locatio
n
Strongly
disagree
Count 10 7 17
Expected
count
7.8 9.2 17.0
Disagree Count 14 9 23
Expected
count
10.6 12.4 23.0
Neutral Count 5 3 8
Expected
count
3.7 4.3 8.0
Agree Count 13 25 38
Expected
count
17.5 20.5 38.0
Strongly agree Count 4 10 14
Expected
count
6.4 7.6 14.0
Total Count 46 54 100
Expected
count
46.0 54.0 100.0
46
(C 5.3) Chi-square tests
Value Df
Asymptotic
significance
(2-sided)
Pearson chi-square 7.888a
4 .096
N of valid cases 100
A. 2 cells (20.0%) have expected count less than 5.
The minimum expected count is 3.68.
Calculated value of Chi-square is 7.888 . Chi-square at 5% Significance Level and 4
Degree of Freedom with p = .096 . As the calculated value of p is more than the
critical value .05, Null hypothesis is accepted and alternative hypothesis is rejected ,
revealing that there is no significance impact of Education Level on Attitude of
employees towards Location Of Training Program
Marital status
H0 – There is no significance impact of Marital Status on Attitude of employees
towards Location of Training Program
H1 – There is significance impact of Marital Status on Attitude of employees towards
Location of Training Program
(T 5.4) Location * marital status crosstabulation
Marital status
TotalMarried
Unmarrie
d
Locatio
n
Strongly
disagree
Count 16 1 17
Expected
count
11.2 5.8 17.0
Disagree Count 19 4 23
Expected
count
15.2 7.8 23.0
Neutral Count 5 3 8
Expected
count
5.3 2.7 8.0
47
Agree Count 21 17 38
Expected
count
25.1 12.9 38.0
Strongly agree Count 5 9 14
Expected
count
9.2 4.8 14.0
Total Count 66 34 100
Expected
count
66.0 34.0 100.0
(C 5.4) Chi-square tests
Value Df
Asymptotic
significance
(2-sided)
Pearson chi-square 16.535a
4 .002
Likelihood ratio 18.255 4 .001
Linear-by-linear
association
16.117 1 .000
N of valid cases 100
A. 2 cells (20.0%) have expected count less than 5.
The minimum expected count is 2.72.
Calculated value of Chi-square is 16.535. Chi-square at 5% Significance Level and 4
Degree of Freedom with p = .002 . As the calculated value of p is less than the
critical value .05, Null hypothesis is rejected and alternative hypothesis is accepted ,
revealing that there is significance impact of Marital Status on Attitude of
employees towards Location Of Training Program
Designation
H0 – There is no significance impact of Designation Level on Attitude of employees
towards Location of Training Program
H1 – There is significance impact of Designation Level on Attitude of employees
towards Location of Training Program
48
(T 5.5) Location * designation level crosstabulation
Designation level
TotalBottom Middle Top
Locatio
n
Strongly
disagree
Count 7 6 4 17
Expected
count
3.6 5.6 7.8 17.0
Disagree Count 9 8 6 23
Expected
count
4.8 7.6 10.6 23.0
Neutral Count 2 6 0 8
Expected
count
1.7 2.6 3.7 8.0
Agree Count 3 9 26 38
Expected
count
8.0 12.5 17.5 38.0
Strongly agree Count 0 4 10 14
Expected
count
2.9 4.6 6.4 14.0
Total Count 21 33 46 100
Expected
count
21.0 33.0 46.0 100.0
(C 5.5) Chi-square tests
Value Df
Asymptotic
significance
(2-sided)
Pearson chi-square 32.062a
8 .000
N of valid cases 100
A. 7 cells (46.7%) have expected count less than 5.
The minimum expected count is 1.68.
Calculated value of Chi-square is 32.062 . Chi-square at 5% Significance Level and
8 Degree of Freedom with p = .000 . As the calculated value of p is less than the
critical value .05, Null hypothesis is rejected and alternative hypothesis is accepted ,
revealing that there is significance impact of Designation Level on Attitude of
employees towards Location Of Training Program
49
FINDINGS
 There is significant impact of Employee’s age on their attitude towards
Importance of Training.
 There is significance impact of Marital Status on Attitude of employees
Towards Importance of Training
 There is significance impact of Age on Attitude of employees towards Training
Hours per Day
 There is significance impact of Gender on Attitude of employees towards
Training Hours per Day
 There is significance impact of Educational on Attitude of employees towards
Training Hours per Day
 There is significance impact of Marital Status on Attitude of employees
towards Training Hours per Day
 There is significance impact of Marital Status on Attitude of employees
towards Number of Training Days
 There is significance impact of Age on Attitude of employees towards
Intervals between Trainings.
 There is significance impact of Gender on Attitude of employees towards
Intervals between Trainings.
 There is significance impact of Age on Attitude of employees towards
Location Of Training Program
 There is significance impact of Gender on Attitude of employees towards
Location Of Training Program
 There is significance impact of Marital Status on Attitude of employees
towards Location Of Training Program
 There is significance impact of Designation Level on Attitude of employees
towards Location Of Training Program
 There is no significant impact of Gender of employees on their attitude
towards Importance of Training.
 There is no significance impact of Educational Level on Attitude of employees
towards Importance of Training
50
 There is no significance impact of Designation Level on Attitude of employees
towards Importance of Training
 There is no significance impact of Designation Level on Attitude of employees
towards Training Hours per Day
 There is no significance impact of on Attitude of Gender employees towards
Number of Training Days.
 There is no significance impact of Educational Level on Attitude of employees
towards Number of Training Days
 There is no significance impact of on Attitude of employees towards Number
of Training Days
 There is no significance impact of Educational Level on Attitude of employees
towards Intervals between Trainings
 There is no significance impact of Marital Status on Attitude of employees
towards Intervals between Trainings.
 There is no significance impact of Designation Level on Attitude of employees
towards Intervals between Trainings.
 There is no significance impact of Education Level on Attitude of employees
towards Location Of Training Program
51
Conclusion
This study concludes that each employee have different attitude towards
different factors of training program. Attitude of employees are influenced by many
factors which includes demographic factors too. As seen in the study, when
employees were grouped demographically, they showed similar characteristics with
employees of their own group and different characteristics from other groups.
Training and Development have advantages not only for employee but the
ultimate benefit is for the organization itself. If the performance of the employee is
not good it will affect the whole organization. The demographic factors such as age,
gender, educational qualifications, marital status and designation contribute towards
attitude formation of the employees towards Training Program.
Age of employee impact their attitude towards importance of training, training
hours per day, Intervals between trainings, Location Of Training Program.
Gender of employee impact their attitude towards Training Hours per Day, Intervals
between trainings, Location of Training Program. Educational Level of employee
impact their attitude towards Training Hours per Day. Marital Status of employee
impacts their attitude towards Importance of Training, Training Hours per Day,
Number of Training Days, Location Of Training Program. Designation of employee
impacts their attitude towards Location Of Training Program.
So to design an effecting Training program the HR department must consider
the demographic background of their employees along with other factors.
52
Recommendations
 The results of the study can be utilized by practitioners in relooking or
revamping their strategies for designing Training Programs
 HR department should study negative attitude of employees towards training
and direct it towards better direction
 As demographic factor of employees affect how employees perceive training,
it should be considered while designing training programs
 Difference in attitude by different demographic group should be used to make
training program more effective
 On basis of how employees perceive training, they should be educated
towards importance of training program as its factors
 Training hours per day for employees of elderly age should be reduced
 Location of training for Female employees should not be kept much away
from their place of living/working
 Less educated employees should be educated towards importance of training
and its effect on individual and on organisation
 Married Employees’ Training Location should be kept near and if not, of less
days
 To design an effecting Training program the HR department must consider
the demographic background of their employees along with other factors.
53
Limitations
 The study do not undertake emotional and personal characteristics of
employees which too impact the formation of attitude
 Study is a sample study and hence do not represent exact attitude of each
and every employee of population
 Study do not undertake impact of nearby environment of employee which
may affect their attitude
 Convenience method of sample selection was done therefore probabilistic
sampling could not be assigned
 Question were asked indirectly and are translated therefore exact attitude
of employee could be misjudged
 5 pointed Likert scale was used which is less expressive than a 7 pointed
Likert scale
54
References
1. Muhammad zahid iqbal, et.al., (2011). An empirical analysis of the relationship
between characteristics and formative evaluation of training. The international journal
of business research 4 (1): 273-86.
2. Eugen rotarescu, (2010). Alternative selection under risk conditions in human
resource training and development through the application of the estimated
monetary value and decision tree analysis. Journal of management and economics 4
(60): 468-75.
3 pilar pineda, (2010). Evaluation of training in organizations: a proposal for an
integrated model. Journal of european industrial training 34(7): 673-93.
4. Cary cherniss, et.al., (2010). Process-designed training: a new approach for
helping leaders develop emotional and social competence. Journal of management
development 29(5): 413-31.
5. Thomas andersson, (2010). Struggles of managerial being and becoming:
experiences from managers’ personal development training. Journal of management
development 29(2): 167-76.
6. David mcguire and mammed bagher, (2010). Diversity training in organisations:
an introduction. Journal of european industrial training 34 (6): 493-505.
7. Cody b. Cox and margaret e. Beier, (2009). The moderating effect of individual
differences on the relationship between the framing of training and interest in
training. The international journal training and development 13(4): 247-60.
8. Franco gandolfi, (2009). Training and development in an era of downsizing.
Journal of management research 9(1): 314.
9. David pollitt, (2009). Training team shines at axa sun life. Journal of human
resource management international digest 17(5): 23-24. 10. David pollitt, (2009).
Thomson reuters maps new relationships in learning and collaboration. Journal of
human resource management international digest 17(4): 24-6.

More Related Content

PDF
Job Stress among Women College Teachers of Belthangady Taluk: An Empirical Study
International Journal of Business Marketing and Management (IJBMM)
 
PDF
Student’s Preception Of Lecturer Achievement Index In Uhw Perbanas Surabaya W...
International Journal of Business Marketing and Management (IJBMM)
 
PDF
Effectiveness of orientation programmes offered for the employees of public s...
Alexander Decker
 
PDF
Manswr ali m
Manswr Al Wealny
 
PDF
Training and development introduction and overview trf
Muddassir Karnolwal
 
PDF
Training and development
siva sankar
 
DOCX
Synopisis
Lata A G
 
PDF
Employee perception towards effective training program a study on some select...
Alexander Decker
 
Job Stress among Women College Teachers of Belthangady Taluk: An Empirical Study
International Journal of Business Marketing and Management (IJBMM)
 
Student’s Preception Of Lecturer Achievement Index In Uhw Perbanas Surabaya W...
International Journal of Business Marketing and Management (IJBMM)
 
Effectiveness of orientation programmes offered for the employees of public s...
Alexander Decker
 
Manswr ali m
Manswr Al Wealny
 
Training and development introduction and overview trf
Muddassir Karnolwal
 
Training and development
siva sankar
 
Synopisis
Lata A G
 
Employee perception towards effective training program a study on some select...
Alexander Decker
 

What's hot (20)

PDF
Feedback Analysis of the Human Resource Training Programme
Premier Publishers
 
PDF
Dm4301674680
IJERA Editor
 
PDF
Academic Supervision toward Teacher’s Performance through Motivation as Inter...
Journal of Education and Learning (EduLearn)
 
PDF
Impact of Training and Development, training design and on the job training ...
inventionjournals
 
PPTX
Research study presentation
Crusher James
 
PDF
The Effect of Human Resources Practice on the Job Satisfaction of Employees a...
inventionjournals
 
PPTX
Busm4306 - A1 - Group 11
MuhammadIrfanBinAbdu
 
PDF
C352033.pdf
ajmrdjournals
 
DOC
A study on_the_factors_influencing_the_effectiveness_of_internship_trainin
Sheham Aliyar
 
DOCX
Mr nader des (3)
chirchir paul
 
PDF
Dd35584588
IJERA Editor
 
PDF
The Influence of Principal Leadership Style and Teacher Work Motivation on th...
Journal of Education and Learning (EduLearn)
 
PDF
Ej1106539
Jareeporn Poonchai
 
DOCX
Hrd 8
Rajib Rahman
 
PPTX
HRM module 4
ARUNKUMAR7358
 
PDF
International Journal of Business and Management Invention (IJBMI)
inventionjournals
 
PPTX
STRATEGIC AND OPERATIONAL MANAGEMENT-8615
EqraBaig
 
PDF
The Influence of Feedback Environment on Self-Efficacy of Teaching: The Role ...
Universiti Sains Malaysia
 
PPTX
PERFORMANCE MANAGEMENT-8615
EqraBaig
 
PDF
06. mukhtar, hapzi ali, mahdalena, uin jambi, www.iosrjournals.org
Hapzi Ali
 
Feedback Analysis of the Human Resource Training Programme
Premier Publishers
 
Dm4301674680
IJERA Editor
 
Academic Supervision toward Teacher’s Performance through Motivation as Inter...
Journal of Education and Learning (EduLearn)
 
Impact of Training and Development, training design and on the job training ...
inventionjournals
 
Research study presentation
Crusher James
 
The Effect of Human Resources Practice on the Job Satisfaction of Employees a...
inventionjournals
 
Busm4306 - A1 - Group 11
MuhammadIrfanBinAbdu
 
C352033.pdf
ajmrdjournals
 
A study on_the_factors_influencing_the_effectiveness_of_internship_trainin
Sheham Aliyar
 
Mr nader des (3)
chirchir paul
 
Dd35584588
IJERA Editor
 
The Influence of Principal Leadership Style and Teacher Work Motivation on th...
Journal of Education and Learning (EduLearn)
 
HRM module 4
ARUNKUMAR7358
 
International Journal of Business and Management Invention (IJBMI)
inventionjournals
 
STRATEGIC AND OPERATIONAL MANAGEMENT-8615
EqraBaig
 
The Influence of Feedback Environment on Self-Efficacy of Teaching: The Role ...
Universiti Sains Malaysia
 
PERFORMANCE MANAGEMENT-8615
EqraBaig
 
06. mukhtar, hapzi ali, mahdalena, uin jambi, www.iosrjournals.org
Hapzi Ali
 
Ad

Similar to A (20)

DOC
Employees perception towards training conducted at hamul
Projects Kart
 
PDF
9 2-2020 training effectiveness
RaymondNiehaus
 
PDF
Human Resoruce - Training and development (GSK Glaxosmithkline India)
←ครђเรђ Batra
 
PDF
Training and development by binod bihari pradhan
BinodPradhan9
 
DOCX
bba final research
Kinjal Desai
 
DOCX
Designing a training module and analysing its effectiveness a study in hinda...
ShreeAyush
 
PDF
Ijmet 10 01_061
IAEME Publication
 
DOC
93853961-Training-and-Development-in-NALCO-Final-Report.doc
mp2641748
 
DOC
Training And Development
Jiten Menghani
 
PDF
Job Satisfaction and Training of Employees
deshwal852
 
DOCX
Training defined
dibyenxxx
 
DOCX
Training & development Introduction
Refkin
 
PPTX
Krishna Final Review 1 - 30 - 07.01.2025.pptx
krishnaA74
 
PPTX
Impact of Training and Development on Employee Performance
krishnaA74
 
PPTX
Impact of Training and Development on Employee Performance
krishnaA74
 
PDF
The impact of employees training on the job performance
missnurin
 
DOCX
Research paper - Training and Development
Sanjana Meduri
 
PPTX
Designing Training Part 2.pptx
RoniAli2
 
Employees perception towards training conducted at hamul
Projects Kart
 
9 2-2020 training effectiveness
RaymondNiehaus
 
Human Resoruce - Training and development (GSK Glaxosmithkline India)
←ครђเรђ Batra
 
Training and development by binod bihari pradhan
BinodPradhan9
 
bba final research
Kinjal Desai
 
Designing a training module and analysing its effectiveness a study in hinda...
ShreeAyush
 
Ijmet 10 01_061
IAEME Publication
 
93853961-Training-and-Development-in-NALCO-Final-Report.doc
mp2641748
 
Training And Development
Jiten Menghani
 
Job Satisfaction and Training of Employees
deshwal852
 
Training defined
dibyenxxx
 
Training & development Introduction
Refkin
 
Krishna Final Review 1 - 30 - 07.01.2025.pptx
krishnaA74
 
Impact of Training and Development on Employee Performance
krishnaA74
 
Impact of Training and Development on Employee Performance
krishnaA74
 
The impact of employees training on the job performance
missnurin
 
Research paper - Training and Development
Sanjana Meduri
 
Designing Training Part 2.pptx
RoniAli2
 
Ad

More from Akshay Gaikwad (20)

DOCX
Benefit of demerger
Akshay Gaikwad
 
PPT
Alliance corporate-presentation-new
Akshay Gaikwad
 
PPT
21546858 effect-of-inflation-deflation-on-aviation-sector
Akshay Gaikwad
 
PPTX
Pf (3)
Akshay Gaikwad
 
PDF
Review notes -_an_overview_of_financial_services
Akshay Gaikwad
 
PPTX
Mris
Akshay Gaikwad
 
PPTX
Presentationzara 140319065950-phpapp01
Akshay Gaikwad
 
PPTX
Powerpointpresentationonzarabyjitu 131228043933-phpapp02
Akshay Gaikwad
 
PDF
Multimedia associa pdf_tm-zara
Akshay Gaikwad
 
PDF
Investec may-2015-policy-bazaar
Akshay Gaikwad
 
PDF
Insurance services
Akshay Gaikwad
 
PDF
Indus ind bank pressrelease-q2fy16
Akshay Gaikwad
 
DOCX
Indusind
Akshay Gaikwad
 
PDF
Indus ind bank press release- q3 fy16r
Akshay Gaikwad
 
PPTX
Imp zaracompanyprofilewithhistoryandmarketingstrategy 170415065651
Akshay Gaikwad
 
PDF
Hpcl ds auto_lubricants_digital_brochure hp gasenol 20_w 50
Akshay Gaikwad
 
PDF
Fintech innovators-2016
Akshay Gaikwad
 
PDF
Hpcl gas engine oils
Akshay Gaikwad
 
PPTX
Eb aquesha
Akshay Gaikwad
 
PDF
En acea
Akshay Gaikwad
 
Benefit of demerger
Akshay Gaikwad
 
Alliance corporate-presentation-new
Akshay Gaikwad
 
21546858 effect-of-inflation-deflation-on-aviation-sector
Akshay Gaikwad
 
Review notes -_an_overview_of_financial_services
Akshay Gaikwad
 
Presentationzara 140319065950-phpapp01
Akshay Gaikwad
 
Powerpointpresentationonzarabyjitu 131228043933-phpapp02
Akshay Gaikwad
 
Multimedia associa pdf_tm-zara
Akshay Gaikwad
 
Investec may-2015-policy-bazaar
Akshay Gaikwad
 
Insurance services
Akshay Gaikwad
 
Indus ind bank pressrelease-q2fy16
Akshay Gaikwad
 
Indusind
Akshay Gaikwad
 
Indus ind bank press release- q3 fy16r
Akshay Gaikwad
 
Imp zaracompanyprofilewithhistoryandmarketingstrategy 170415065651
Akshay Gaikwad
 
Hpcl ds auto_lubricants_digital_brochure hp gasenol 20_w 50
Akshay Gaikwad
 
Fintech innovators-2016
Akshay Gaikwad
 
Hpcl gas engine oils
Akshay Gaikwad
 
Eb aquesha
Akshay Gaikwad
 

Recently uploaded (20)

PDF
BÀI TẬP TEST BỔ TRỢ THEO TỪNG CHỦ ĐỀ CỦA TỪNG UNIT KÈM BÀI TẬP NGHE - TIẾNG A...
Nguyen Thanh Tu Collection
 
PPTX
How to Manage Leads in Odoo 18 CRM - Odoo Slides
Celine George
 
PPTX
Five Point Someone – Chetan Bhagat | Book Summary & Analysis by Bhupesh Kushwaha
Bhupesh Kushwaha
 
PPTX
Virus sequence retrieval from NCBI database
yamunaK13
 
PPTX
A Smarter Way to Think About Choosing a College
Cyndy McDonald
 
PPTX
Information Texts_Infographic on Forgetting Curve.pptx
Tata Sevilla
 
PPTX
CDH. pptx
AneetaSharma15
 
PDF
Antianginal agents, Definition, Classification, MOA.pdf
Prerana Jadhav
 
PPTX
Basics and rules of probability with real-life uses
ravatkaran694
 
PPTX
Cleaning Validation Ppt Pharmaceutical validation
Ms. Ashatai Patil
 
PPTX
Kanban Cards _ Mass Action in Odoo 18.2 - Odoo Slides
Celine George
 
PDF
Review of Related Literature & Studies.pdf
Thelma Villaflores
 
PDF
The-Invisible-Living-World-Beyond-Our-Naked-Eye chapter 2.pdf/8th science cur...
Sandeep Swamy
 
PPTX
Gupta Art & Architecture Temple and Sculptures.pptx
Virag Sontakke
 
PPTX
An introduction to Prepositions for beginners.pptx
drsiddhantnagine
 
PDF
Virat Kohli- the Pride of Indian cricket
kushpar147
 
PPTX
Tips Management in Odoo 18 POS - Odoo Slides
Celine George
 
PPTX
How to Apply for a Job From Odoo 18 Website
Celine George
 
PPTX
20250924 Navigating the Future: How to tell the difference between an emergen...
McGuinness Institute
 
DOCX
pgdei-UNIT -V Neurological Disorders & developmental disabilities
JELLA VISHNU DURGA PRASAD
 
BÀI TẬP TEST BỔ TRỢ THEO TỪNG CHỦ ĐỀ CỦA TỪNG UNIT KÈM BÀI TẬP NGHE - TIẾNG A...
Nguyen Thanh Tu Collection
 
How to Manage Leads in Odoo 18 CRM - Odoo Slides
Celine George
 
Five Point Someone – Chetan Bhagat | Book Summary & Analysis by Bhupesh Kushwaha
Bhupesh Kushwaha
 
Virus sequence retrieval from NCBI database
yamunaK13
 
A Smarter Way to Think About Choosing a College
Cyndy McDonald
 
Information Texts_Infographic on Forgetting Curve.pptx
Tata Sevilla
 
CDH. pptx
AneetaSharma15
 
Antianginal agents, Definition, Classification, MOA.pdf
Prerana Jadhav
 
Basics and rules of probability with real-life uses
ravatkaran694
 
Cleaning Validation Ppt Pharmaceutical validation
Ms. Ashatai Patil
 
Kanban Cards _ Mass Action in Odoo 18.2 - Odoo Slides
Celine George
 
Review of Related Literature & Studies.pdf
Thelma Villaflores
 
The-Invisible-Living-World-Beyond-Our-Naked-Eye chapter 2.pdf/8th science cur...
Sandeep Swamy
 
Gupta Art & Architecture Temple and Sculptures.pptx
Virag Sontakke
 
An introduction to Prepositions for beginners.pptx
drsiddhantnagine
 
Virat Kohli- the Pride of Indian cricket
kushpar147
 
Tips Management in Odoo 18 POS - Odoo Slides
Celine George
 
How to Apply for a Job From Odoo 18 Website
Celine George
 
20250924 Navigating the Future: How to tell the difference between an emergen...
McGuinness Institute
 
pgdei-UNIT -V Neurological Disorders & developmental disabilities
JELLA VISHNU DURGA PRASAD
 

A

  • 1. 1 A Research analysis On “Impact of Demographic Factors on Employees’ Attitude towards Training Program” Submitted to- Dr. A. C. Bhrambhatt Submitted by- Akshay Gaikwad (20165003) Aquesha Tirmizi (20165005) Puja Tripathi (20165028) Radhika Sarda (20165029)
  • 2. 2 Summary  Purpose The purpose of this study is to investigate the impact of employees’ demographic factors on their attitude towards training program.  Approach The study examined the responses of 100 employees, with different demographic factors such as their age, gender, qualification, marital status and designation. The questions asked contained information about the employee attitudes towards the training program as they perceived, as well as training in general.  Findings The results of the study provide support to the hypotheses proposed, indicating that there is a significant relation between employees’ demographic factors and their attitude towards certain factors of training such as importance of training, training hours, training days, interval between training and training location.  Conclusion Demographic factor of employees have some Impact on their attitude formation towards training  Practical Implications The implications of the findings of this study for managers and especially for human resource professionals are quite significant, given their roles in funding, designing and delivering training intervention. Study tells about present attitude of employees which helps in understanding present employees’ attitude and design training program to get maximum participation, improve/influence employees attitude to get more effective outcome from each training program. And ultimately Design more successful and efficient training program  Research limitations The study is limited to examining employee feelings, perception, attitude, not taking into account their personal characteristics, which may be important.
  • 3. 3 Abstract Human resource on most important as that of any business this asset has to be given proper guideline and continuous development in order to yield the best result. Training is most popular method of making employees familiar with important and new concept necessary for business but providing training alone do not guarantee the final results one of the main determinant is how employees takes the training their attitude and perception Attitude of employees towards training are driven by different factors which includes the demographic factors, this study is intended to know how demographic factors influence attitudes of employees towards training. Sample of employees with different demographic factors is studied and it is seen how these factors results in difference of attitude in employees. The study is divided into Six parts. The First part is about the introduction to study. This part explains the concept of Training, its need, issue, process and result of a well-executed training and how demographic factors are important variables. The Second part is about literature review. Certain previous research which was held in related field was taken into consideration before formulating the research. Literature review from books, journals, research papers etc were taken. The Third part contains Background of study, Objectives, Problem statement, Scope, Hypothesis and Research Methodology. The Forth part consists of data analysis and interpretation. The data was coded and tabulated in spreadsheet. Statistical tools have been used in this study. Chi-square test has been applied to analyse the data. Statistical software (SPSS) has been used for data analysis. The Fifth part contains Findings, Conclusion and Recommendations of and from the study.
  • 4. 4 Introduction Training is the one of the most important function of human resource in any organization. It increases the efficiency and the effectiveness of both employees and the organization.in this competitive world, training plays an important role in the competent and challenging format of business. Training is the nerve that suffices the need of fluent and smooth functioning of work which helps in enhancing the quality of work life of employees and organizational development too. Every organization needs to study the role, importance and advantages of training and its positive Impact on development for the growth of the organization. Quality of work life is a process in which the organization recognizes their responsibility for excellence of organizational performance as well as employee skills. Training implies constructive development in such organizational motives for optimum enhancement of quality of work life of the employees. These types of training and development programs help in improving the employee behaviour and attitude towards the job and also uplift their morale. Thus, employee training and development programs are important aspects which are needed to be studied and focused on The man power must be properly recruited, nourished and utilized. Every organization must have its own human resource policies, procedures, rules, regulations, strategies and so on. For this purpose the organization must have separate department called HRD/T&D, which will all the times strive to manage and develop the human resource in organization. Though there are some studies in this field, there are some gaps in them. There haven’t been studies which show how the demographic factors of employees affect their attitude towards different aspects such as training. Demographic factors play very important role in sculpturing personality of an individual that in results in his behaviour and attitude towards different things, little inquiry was done as to the demographic factors that could determine the strength of its differential Impact on people from diverse backgrounds. This limitation is evident in this brief literature review. Given this context, the following could be reviewed as a humble attempt to contribute to the enlightenment of this subject matter. Gender : There was a study providing a correlation between gender and level of learning (Schodt 2005). It was supposed that males, generally, have higher levels of affect than female students in classroom scenarios where instructors used no technology, whereas female students reported higher levels initial affect than male students in classroom scenarios where instructors used moderate amounts of technology (Schrodt 2005). Nonetheless, is was also observed that across genders, continued incremental use of technology would eventually lead to a point to diminishing return. Age Older people have relatively slower perceptual learning than younger ones (gilbert 1996). This input could be factored in the designing materials for audiences of varying ages. Mungania (2003), in his description of the e-learning users, asserted that middle-aged people account for the great part of the educational approach’s audience, with 80% of the polled respondents belonging to the lower that 45 years.
  • 5. 5 Level of education In his presentation, Mungania (2003) suggested people who have a relatively high degree of academic and professional education. In his backdrop of e-learners, he maintained that 37% are bachelor’s degree holders, 56% continue studying while in the office, 80% have been enrolled in no less than ten online courses and that 96% are intermediate and advanced uses of computer training exposure and that 87% registered warm acceptance of the modern learning approach Marital status This have Impact on how employee live outside the organisation, what are factors that affect decisions of employee other than the work Designation represents the authority and responsibility of employee determining his perception on different aspects of job Knowing this will not only help in designing better training program and yield more out of it, it will also help at different level right starting from recruitment process. Although studies are present on training, the information provided by them is not suitable and sufficient for present context. More over in review of literature some missing links are observed. So this study is to be conducted to fill the gap and also add to the existing literature in the field of hr practices.
  • 6. 6 Training Training aims to achieve behaviour change resulting a change in performance and improvement in skills which is measurable. Training is not the end itself but a means to an end. To be effective, training needs to be learner oriented as opposed to trainer oriented. Its aim is to stimulate and help learners to learn rather than to impose upon the trainee what the trainer believes should be learnt so the trainer must use learner oriented techniques. In this chapter basic concepts of learning, training objectives, needs, methods, advantages and evaluation are discussed to throw light on training and development since training remains as the most powerful motivating factor for human system. Training should be viewed as a long term investment in human resources using the equation. Performance = ability x motivation Training has Impact on both the factors. It can improve skills and abilities of the employees and their motivation by increasing their sense of commitment and encouraging them to develop and use new skills. It is a powerful tool that can have a major Impact on both employees’ productivity and morale. An organisation’s effectiveness depends on its Ability to accomplish the following three objectives. I. To achieve its goals. Ii. To maintain itself internally and Iii. To adapt to its environment. Issues In Training The following are the objectives of training programmes.  To prepare employees for the job meant for them on first Appointment/promotion/transfer and impart to them the required skill and knowledge.  To assist employees to function more effectively in their present position by exposing them to the latest concepts/information/ technologies and develop skills that would be required in their particular fields.  To build a second line competent officers and prepare them to occupy more responsible positions.  Training must be based on ogranisation and individual needs.  Training should address problems that need to be solved.  Training should be based on sound theories of learning.  Training should be evaluated periodically and make modifications in the Training programmes whenever necessary.  Training should be a continuous process for employees.
  • 7. 7 Need For Training Training is needed for the following reasons  New incumbents and inexperienced employees require training for Effective performance on the job  Employees not only to work but work more effectively with minimum Supervision, minimum cost, less waste and produce good quality Services.  Increasing use of fast changing techniques in production and other Operations require training into new methods for the operatives.  Experienced employees need refresher training to enable them to keep Abreast of changing techniques and the use of sophisticated tools and Equipments.  Training is necessary when a person has to move from one job to another because of promotion / transfer. Stages of Training and Development Programs Training should be conducted in a systematic order so as to derive expected benefits from it. The training system involves four stages, namely: a. Assessment of training and development programs needs. B. Designing the training and development programs. C. Implementation of the training program d. Evaluation of the training program stages in training and development programs (source: p. Subba Rao, “essentials of human resource management and industrial relations” Himalaya publication house, 3rd revised & enlarged edition 2009, pg-199- 203) A WELL-PLANNED AND WELL-EXECUTED TRAINING PROGRAMME SHOULD RESULT IN :- 1) Reduction in waste and spoilage; 2) Reduction in manpower obsolescence; 3) Reduction in learning time; 4) Reduction in supervisory burden; 5) Reduction in machine breakage and maintenance cost; 6) Reduction in accident rate;
  • 8. 8 7) Improvement in methods of word 8) Improvement in quality of products; 9) Improvement in production rate; 10)Improvement of morale and reduction in grievances; 11)Improvement of efficiency and productivity; 12)Enabling the organisation to provide increased financial incentives, opportunity for internal 13)Promotion and raising of pay rates; 14)Wider awareness among participants, enlarged skill; and personal growth.
  • 9. 9 Research Objectives Primary  To study how different demographic factor influence attitude of employees towards training Program  To offer suggestions and recommendations for more effective design of training program Secondary  To assign perception of employees sharing same demographic factor  To study whether employees with different demographic factors differ in their attitude  To make present training program more effective  To direct attitude of employees in right direction  To redesign training programs  To associate employees personal factors like age, experience and education and the employee’s attitude on training. Background of study  Employees recruited for company rarely 100% fits in job description and job specification  In order to match the present knowledge skills and ability of employees to that of required, training is imparted  Training increases the job performance of employees and help organisation to grow more.  Many factors contribute towards formation of attitude of an employee  Demographic factors play huge role in determining the attitude of employees  Attitude of employees determines how he is/will perceive anything Hence it is important to see if demographic factors play part in formation of attitude toward training. Problem Statement “Impact of Demographic Factors on Employees’ Attitude towards Training Program” . 1. Does demographic factors influence attitude of employees? 2. Does demographic factor of employees affect how they perceive training? 3. How attitude of employees determines success of training program ?
  • 10. 10 4. How does demographic factor influence attitude of employees towards training ? 5. How does attitude of employees differs as per difference in their demographic background? Scope Study was conducted on 100 employees of ONGC Ahmedabad on the basis of training that they have gone through and their attitude towards that training(s). Demographic factors to be studied are their, -Age, -Gender, -Marital Status, -Education and -Designation In the company and their Impact on attitude factor of employees, toward training, such as - Importance of training, -Training programs hours per day -Duration of a whole training program -Interval between Training Programs - Location of training Program
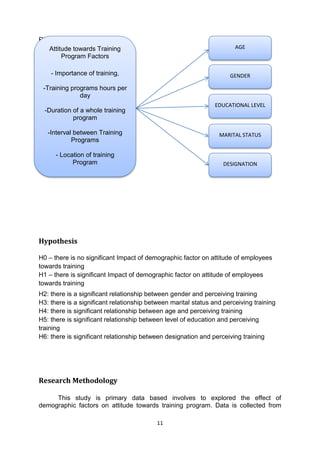
  • 11. 11 RDF/ Hypothesis H0 – there is no significant Impact of demographic factor on attitude of employees towards training H1 – there is significant Impact of demographic factor on attitude of employees towards training H2: there is a significant relationship between gender and perceiving training H3: there is a significant relationship between marital status and perceiving training H4: there is significant relationship between age and perceiving training H5: there is significant relationship between level of education and perceiving training H6: there is significant relationship between designation and perceiving training Research Methodology This study is primary data based involves to explored the effect of demographic factors on attitude towards training program. Data is collected from Attitude towards Training Program Factors - Importance of training, -Training programs hours per day -Duration of a whole training program -Interval between Training Programs - Location of training Program AGE GENDER EDUCATIONAL LEVEL MARITAL STATUS DESIGNATION
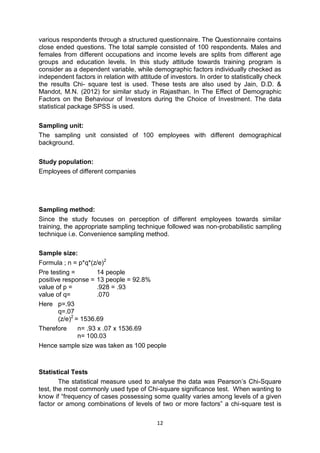
  • 12. 12 various respondents through a structured questionnaire. The Questionnaire contains close ended questions. The total sample consisted of 100 respondents. Males and females from different occupations and income levels are splits from different age groups and education levels. In this study attitude towards training program is consider as a dependent variable, while demographic factors individually checked as independent factors in relation with attitude of investors. In order to statistically check the results Chi- square test is used. These tests are also used by Jain, D.D. & Mandot, M.N. (2012) for similar study in Rajasthan. In The Effect of Demographic Factors on the Behaviour of Investors during the Choice of Investment. The data statistical package SPSS is used. Sampling unit: The sampling unit consisted of 100 employees with different demographical background. Study population: Employees of different companies Sampling method: Since the study focuses on perception of different employees towards similar training, the appropriate sampling technique followed was non-probabilistic sampling technique i.e. Convenience sampling method. Sample size: Formula ; n = p*q*(z/e)2 Pre testing = 14 people positive response = 13 people = 92.8% value of p = .928 = .93 value of q= .070 Here p=.93 q=.07 (z/e)2 = 1536.69 Therefore n= .93 x .07 x 1536.69 n= 100.03 Hence sample size was taken as 100 people Statistical Tests The statistical measure used to analyse the data was Pearson’s Chi-Square test, the most commonly used type of Chi-square significance test. When wanting to know if “frequency of cases possessing some quality varies among levels of a given factor or among combinations of levels of two or more factors” a chi-square test is
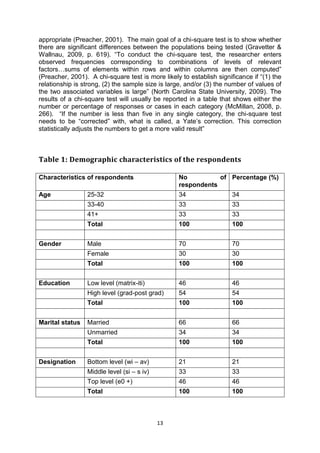
  • 13. 13 appropriate (Preacher, 2001). The main goal of a chi-square test is to show whether there are significant differences between the populations being tested (Gravetter & Wallnau, 2009, p. 619). “To conduct the chi-square test, the researcher enters observed frequencies corresponding to combinations of levels of relevant factors…sums of elements within rows and within columns are then computed” (Preacher, 2001). A chi-square test is more likely to establish significance if “(1) the relationship is strong, (2) the sample size is large, and/or (3) the number of values of the two associated variables is large” (North Carolina State University, 2009). The results of a chi-square test will usually be reported in a table that shows either the number or percentage of responses or cases in each category (McMillan, 2008, p. 266). “If the number is less than five in any single category, the chi-square test needs to be “corrected” with, what is called, a Yate’s correction. This correction statistically adjusts the numbers to get a more valid result” Table 1: Demographic characteristics of the respondents Characteristics of respondents No of respondents Percentage (%) Age 25-32 34 34 33-40 33 33 41+ 33 33 Total 100 100 Gender Male 70 70 Female 30 30 Total 100 100 Education Low level (matrix-iti) 46 46 High level (grad-post grad) 54 54 Total 100 100 Marital status Married 66 66 Unmarried 34 34 Total 100 100 Designation Bottom level (wi – av) 21 21 Middle level (si – s iv) 33 33 Top level (e0 +) 46 46 Total 100 100
  • 14. 14 From the above table it is seen that ;  Percentage of respondents of different age group are 25 to 50 (young to old) are relatively same.  Percentage of male respondents is more than female respondents which are 70 and 30 respectively.  Percentage of respondents with high level education is more than that of low level education which are 54 and 46 respectively.  Percentages of respondents who are married are more than that of unmarried respondents which are 66 and 34 respectively.  21% respondents are at bottom level, 33% respondents are at middle level and 46% respondents are at top level in hierarchy of business.
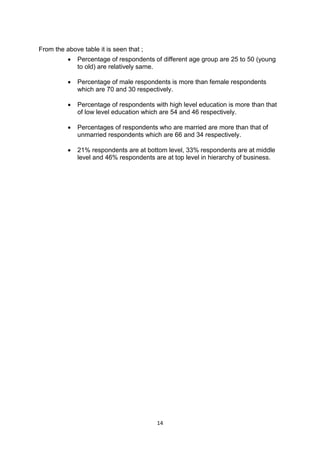
  • 15. 15 Analysis IMPORTANCE OF TRAINING Age wise H0 – There is no significance impact of Age on Attitude of employees towards Importance of training H1 – There is significance impact of Age on Attitude of employees towards Importance of training (T 1.1) Importance * age crosstabulation Age TotalYoung Middle age Old age Importanc e Strongly disagree Count 0 6 2 8 Expected count 2.7 2.6 2.6 8.0 Disagree Count 6 4 2 12 Expected count 4.1 4.0 4.0 12.0 Neutral Count 4 5 1 10 Expected count 3.4 3.3 3.3 10.0 Agree Count 16 14 24 54 Expected count 18.4 17.8 17.8 54.0 Strongly agree Count 8 4 4 16 Expected count 5.4 5.3 5.3 16.0 Total Count 34 33 33 100 Expected count 34.0 33.0 33.0 100.0
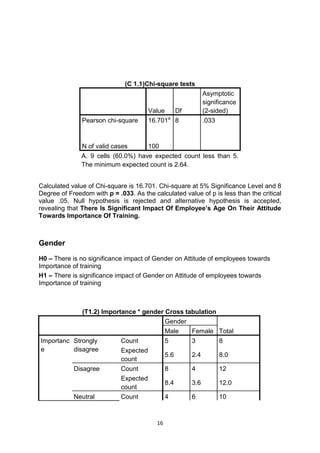
  • 16. 16 (C 1.1)Chi-square tests Value Df Asymptotic significance (2-sided) Pearson chi-square 16.701a 8 .033 N of valid cases 100 A. 9 cells (60.0%) have expected count less than 5. The minimum expected count is 2.64. Calculated value of Chi-square is 16.701. Chi-square at 5% Significance Level and 8 Degree of Freedom with p = .033. As the calculated value of p is less than the critical value .05, Null hypothesis is rejected and alternative hypothesis is accepted, revealing that There Is Significant Impact Of Employee’s Age On Their Attitude Towards Importance Of Training. Gender H0 – There is no significance impact of Gender on Attitude of employees towards Importance of training H1 – There is significance impact of Gender on Attitude of employees towards Importance of training (T1.2) Importance * gender Cross tabulation Gender TotalMale Female Importanc e Strongly disagree Count 5 3 8 Expected count 5.6 2.4 8.0 Disagree Count 8 4 12 Expected count 8.4 3.6 12.0 Neutral Count 4 6 10
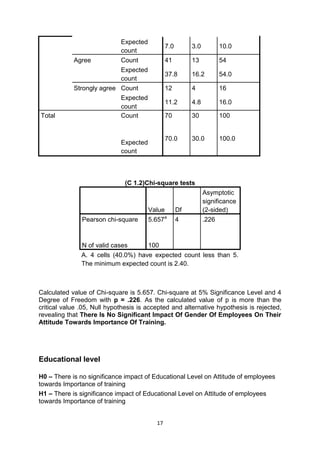
  • 17. 17 Expected count 7.0 3.0 10.0 Agree Count 41 13 54 Expected count 37.8 16.2 54.0 Strongly agree Count 12 4 16 Expected count 11.2 4.8 16.0 Total Count 70 30 100 Expected count 70.0 30.0 100.0 (C 1.2)Chi-square tests Value Df Asymptotic significance (2-sided) Pearson chi-square 5.657a 4 .226 N of valid cases 100 A. 4 cells (40.0%) have expected count less than 5. The minimum expected count is 2.40. Calculated value of Chi-square is 5.657. Chi-square at 5% Significance Level and 4 Degree of Freedom with p = .226. As the calculated value of p is more than the critical value .05, Null hypothesis is accepted and alternative hypothesis is rejected, revealing that There Is No Significant Impact Of Gender Of Employees On Their Attitude Towards Importance Of Training. Educational level H0 – There is no significance impact of Educational Level on Attitude of employees towards Importance of training H1 – There is significance impact of Educational Level on Attitude of employees towards Importance of training
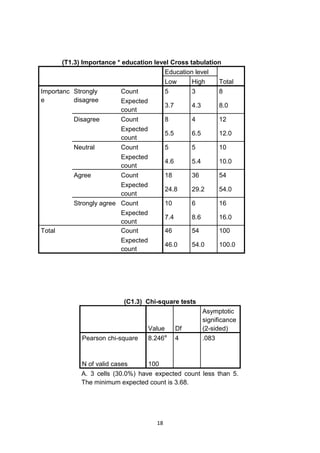
  • 18. 18 (T1.3) Importance * education level Cross tabulation Education level TotalLow High Importanc e Strongly disagree Count 5 3 8 Expected count 3.7 4.3 8.0 Disagree Count 8 4 12 Expected count 5.5 6.5 12.0 Neutral Count 5 5 10 Expected count 4.6 5.4 10.0 Agree Count 18 36 54 Expected count 24.8 29.2 54.0 Strongly agree Count 10 6 16 Expected count 7.4 8.6 16.0 Total Count 46 54 100 Expected count 46.0 54.0 100.0 (C1.3) Chi-square tests Value Df Asymptotic significance (2-sided) Pearson chi-square 8.246a 4 .083 N of valid cases 100 A. 3 cells (30.0%) have expected count less than 5. The minimum expected count is 3.68.
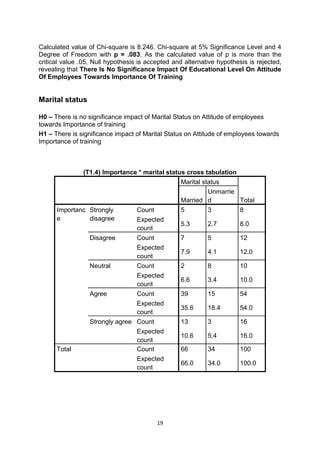
  • 19. 19 Calculated value of Chi-square is 8.246. Chi-square at 5% Significance Level and 4 Degree of Freedom with p = .083. As the calculated value of p is more than the critical value .05, Null hypothesis is accepted and alternative hypothesis is rejected, revealing that There Is No Significance Impact Of Educational Level On Attitude Of Employees Towards Importance Of Training Marital status H0 – There is no significance impact of Marital Status on Attitude of employees towards Importance of training H1 – There is significance impact of Marital Status on Attitude of employees towards Importance of training (T1.4) Importance * marital status cross tabulation Marital status TotalMarried Unmarrie d Importanc e Strongly disagree Count 5 3 8 Expected count 5.3 2.7 8.0 Disagree Count 7 5 12 Expected count 7.9 4.1 12.0 Neutral Count 2 8 10 Expected count 6.6 3.4 10.0 Agree Count 39 15 54 Expected count 35.6 18.4 54.0 Strongly agree Count 13 3 16 Expected count 10.6 5.4 16.0 Total Count 66 34 100 Expected count 66.0 34.0 100.0
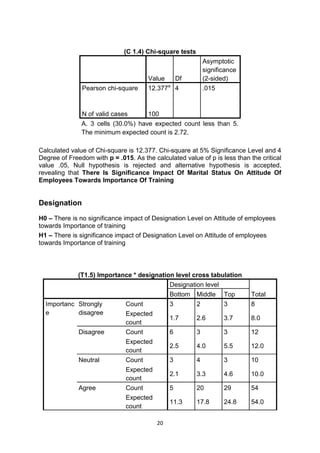
  • 20. 20 (C 1.4) Chi-square tests Value Df Asymptotic significance (2-sided) Pearson chi-square 12.377a 4 .015 N of valid cases 100 A. 3 cells (30.0%) have expected count less than 5. The minimum expected count is 2.72. Calculated value of Chi-square is 12.377. Chi-square at 5% Significance Level and 4 Degree of Freedom with p = .015. As the calculated value of p is less than the critical value .05, Null hypothesis is rejected and alternative hypothesis is accepted, revealing that There Is Significance Impact Of Marital Status On Attitude Of Employees Towards Importance Of Training Designation H0 – There is no significance impact of Designation Level on Attitude of employees towards Importance of training H1 – There is significance impact of Designation Level on Attitude of employees towards Importance of training (T1.5) Importance * designation level cross tabulation Designation level TotalBottom Middle Top Importanc e Strongly disagree Count 3 2 3 8 Expected count 1.7 2.6 3.7 8.0 Disagree Count 6 3 3 12 Expected count 2.5 4.0 5.5 12.0 Neutral Count 3 4 3 10 Expected count 2.1 3.3 4.6 10.0 Agree Count 5 20 29 54 Expected count 11.3 17.8 24.8 54.0
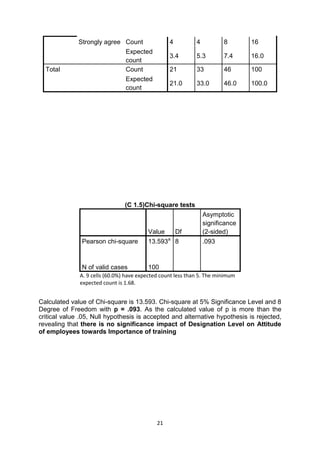
  • 21. 21 Strongly agree Count 4 4 8 16 Expected count 3.4 5.3 7.4 16.0 Total Count 21 33 46 100 Expected count 21.0 33.0 46.0 100.0 (C 1.5)Chi-square tests Value Df Asymptotic significance (2-sided) Pearson chi-square 13.593a 8 .093 N of valid cases 100 A. 9 cells (60.0%) have expected count less than 5. The minimum expected count is 1.68. Calculated value of Chi-square is 13.593. Chi-square at 5% Significance Level and 8 Degree of Freedom with p = .093. As the calculated value of p is more than the critical value .05, Null hypothesis is accepted and alternative hypothesis is rejected, revealing that there is no significance impact of Designation Level on Attitude of employees towards Importance of training
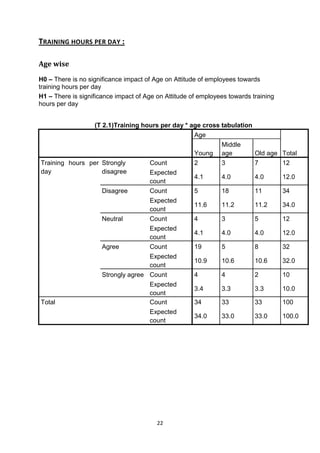
  • 22. 22 TRAINING HOURS PER DAY : Age wise H0 – There is no significance impact of Age on Attitude of employees towards training hours per day H1 – There is significance impact of Age on Attitude of employees towards training hours per day (T 2.1)Training hours per day * age cross tabulation Age TotalYoung Middle age Old age Training hours per day Strongly disagree Count 2 3 7 12 Expected count 4.1 4.0 4.0 12.0 Disagree Count 5 18 11 34 Expected count 11.6 11.2 11.2 34.0 Neutral Count 4 3 5 12 Expected count 4.1 4.0 4.0 12.0 Agree Count 19 5 8 32 Expected count 10.9 10.6 10.6 32.0 Strongly agree Count 4 4 2 10 Expected count 3.4 3.3 3.3 10.0 Total Count 34 33 33 100 Expected count 34.0 33.0 33.0 100.0
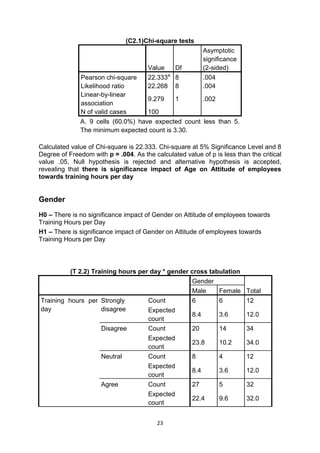
  • 23. 23 (C2.1)Chi-square tests Value Df Asymptotic significance (2-sided) Pearson chi-square 22.333a 8 .004 Likelihood ratio 22.268 8 .004 Linear-by-linear association 9.279 1 .002 N of valid cases 100 A. 9 cells (60.0%) have expected count less than 5. The minimum expected count is 3.30. Calculated value of Chi-square is 22.333. Chi-square at 5% Significance Level and 8 Degree of Freedom with p = .004. As the calculated value of p is less than the critical value .05, Null hypothesis is rejected and alternative hypothesis is accepted, revealing that there is significance impact of Age on Attitude of employees towards training hours per day Gender H0 – There is no significance impact of Gender on Attitude of employees towards Training Hours per Day H1 – There is significance impact of Gender on Attitude of employees towards Training Hours per Day (T 2.2) Training hours per day * gender cross tabulation Gender TotalMale Female Training hours per day Strongly disagree Count 6 6 12 Expected count 8.4 3.6 12.0 Disagree Count 20 14 34 Expected count 23.8 10.2 34.0 Neutral Count 8 4 12 Expected count 8.4 3.6 12.0 Agree Count 27 5 32 Expected count 22.4 9.6 32.0
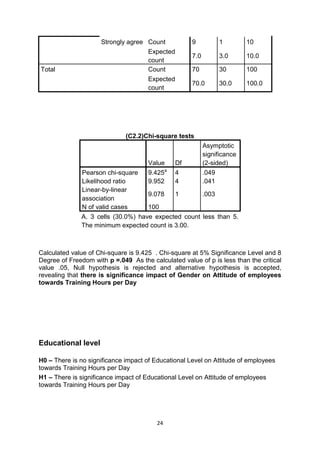
  • 24. 24 Strongly agree Count 9 1 10 Expected count 7.0 3.0 10.0 Total Count 70 30 100 Expected count 70.0 30.0 100.0 (C2.2)Chi-square tests Value Df Asymptotic significance (2-sided) Pearson chi-square 9.425a 4 .049 Likelihood ratio 9.952 4 .041 Linear-by-linear association 9.078 1 .003 N of valid cases 100 A. 3 cells (30.0%) have expected count less than 5. The minimum expected count is 3.00. Calculated value of Chi-square is 9.425 . Chi-square at 5% Significance Level and 8 Degree of Freedom with p =.049 As the calculated value of p is less than the critical value .05, Null hypothesis is rejected and alternative hypothesis is accepted, revealing that there is significance impact of Gender on Attitude of employees towards Training Hours per Day Educational level H0 – There is no significance impact of Educational Level on Attitude of employees towards Training Hours per Day H1 – There is significance impact of Educational Level on Attitude of employees towards Training Hours per Day
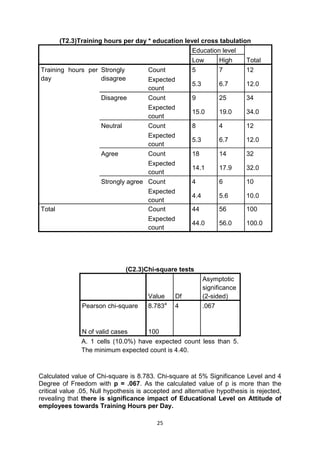
  • 25. 25 (T2.3)Training hours per day * education level cross tabulation Education level TotalLow High Training hours per day Strongly disagree Count 5 7 12 Expected count 5.3 6.7 12.0 Disagree Count 9 25 34 Expected count 15.0 19.0 34.0 Neutral Count 8 4 12 Expected count 5.3 6.7 12.0 Agree Count 18 14 32 Expected count 14.1 17.9 32.0 Strongly agree Count 4 6 10 Expected count 4.4 5.6 10.0 Total Count 44 56 100 Expected count 44.0 56.0 100.0 (C2.3)Chi-square tests Value Df Asymptotic significance (2-sided) Pearson chi-square 8.783a 4 .067 N of valid cases 100 A. 1 cells (10.0%) have expected count less than 5. The minimum expected count is 4.40. Calculated value of Chi-square is 8.783. Chi-square at 5% Significance Level and 4 Degree of Freedom with p = .067. As the calculated value of p is more than the critical value .05, Null hypothesis is accepted and alternative hypothesis is rejected, revealing that there is significance impact of Educational Level on Attitude of employees towards Training Hours per Day.
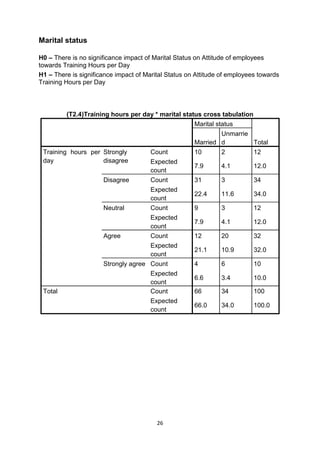
  • 26. 26 Marital status H0 – There is no significance impact of Marital Status on Attitude of employees towards Training Hours per Day H1 – There is significance impact of Marital Status on Attitude of employees towards Training Hours per Day (T2.4)Training hours per day * marital status cross tabulation Marital status TotalMarried Unmarrie d Training hours per day Strongly disagree Count 10 2 12 Expected count 7.9 4.1 12.0 Disagree Count 31 3 34 Expected count 22.4 11.6 34.0 Neutral Count 9 3 12 Expected count 7.9 4.1 12.0 Agree Count 12 20 32 Expected count 21.1 10.9 32.0 Strongly agree Count 4 6 10 Expected count 6.6 3.4 10.0 Total Count 66 34 100 Expected count 66.0 34.0 100.0
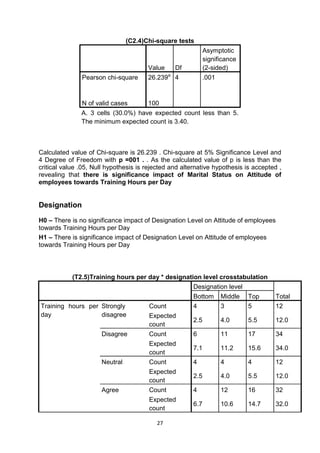
  • 27. 27 (C2.4)Chi-square tests Value Df Asymptotic significance (2-sided) Pearson chi-square 26.239a 4 .001 N of valid cases 100 A. 3 cells (30.0%) have expected count less than 5. The minimum expected count is 3.40. Calculated value of Chi-square is 26.239 . Chi-square at 5% Significance Level and 4 Degree of Freedom with p =001 . . As the calculated value of p is less than the critical value .05, Null hypothesis is rejected and alternative hypothesis is accepted , revealing that there is significance impact of Marital Status on Attitude of employees towards Training Hours per Day Designation H0 – There is no significance impact of Designation Level on Attitude of employees towards Training Hours per Day H1 – There is significance impact of Designation Level on Attitude of employees towards Training Hours per Day (T2.5)Training hours per day * designation level crosstabulation Designation level TotalBottom Middle Top Training hours per day Strongly disagree Count 4 3 5 12 Expected count 2.5 4.0 5.5 12.0 Disagree Count 6 11 17 34 Expected count 7.1 11.2 15.6 34.0 Neutral Count 4 4 4 12 Expected count 2.5 4.0 5.5 12.0 Agree Count 4 12 16 32 Expected count 6.7 10.6 14.7 32.0
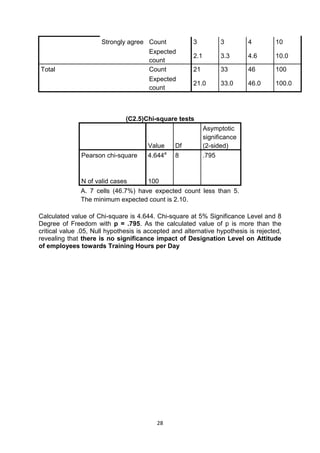
  • 28. 28 Strongly agree Count 3 3 4 10 Expected count 2.1 3.3 4.6 10.0 Total Count 21 33 46 100 Expected count 21.0 33.0 46.0 100.0 (C2.5)Chi-square tests Value Df Asymptotic significance (2-sided) Pearson chi-square 4.644a 8 .795 N of valid cases 100 A. 7 cells (46.7%) have expected count less than 5. The minimum expected count is 2.10. Calculated value of Chi-square is 4.644. Chi-square at 5% Significance Level and 8 Degree of Freedom with p = .795. As the calculated value of p is more than the critical value .05, Null hypothesis is accepted and alternative hypothesis is rejected, revealing that there is no significance impact of Designation Level on Attitude of employees towards Training Hours per Day
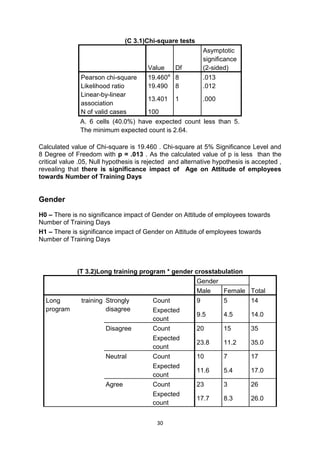
  • 29. 29 NUMBER OF TRAINING DAYS PER PROGRAM : Age wise H0 – There is no significance impact of Age on Attitude of employees towards Number of Training Days H1 – There is significance impact of Age on Attitude of employees towards Number of Training Days (T 3.1)Long training program * age crosstabulation Age TotalYoung Middle age Old age Long training program Strongly disagree Count 3 4 7 14 Expected count 4.8 4.6 4.6 14.0 Disagree Count 6 15 14 35 Expected count 11.9 11.6 11.6 35.0 Neutral Count 4 6 7 17 Expected count 5.8 5.6 5.6 17.0 Agree Count 16 6 4 26 Expected count 8.8 8.6 8.6 26.0 Strongly agree Count 5 2 1 8 Expected count 2.7 2.6 2.6 8.0 Total Count 34 33 33 100 Expected count 34.0 33.0 33.0 100.0
  • 30. 30 (C 3.1)Chi-square tests Value Df Asymptotic significance (2-sided) Pearson chi-square 19.460a 8 .013 Likelihood ratio 19.490 8 .012 Linear-by-linear association 13.401 1 .000 N of valid cases 100 A. 6 cells (40.0%) have expected count less than 5. The minimum expected count is 2.64. Calculated value of Chi-square is 19.460 . Chi-square at 5% Significance Level and 8 Degree of Freedom with p = .013 . As the calculated value of p is less than the critical value .05, Null hypothesis is rejected and alternative hypothesis is accepted , revealing that there is significance impact of Age on Attitude of employees towards Number of Training Days Gender H0 – There is no significance impact of Gender on Attitude of employees towards Number of Training Days H1 – There is significance impact of Gender on Attitude of employees towards Number of Training Days (T 3.2)Long training program * gender crosstabulation Gender TotalMale Female Long training program Strongly disagree Count 9 5 14 Expected count 9.5 4.5 14.0 Disagree Count 20 15 35 Expected count 23.8 11.2 35.0 Neutral Count 10 7 17 Expected count 11.6 5.4 17.0 Agree Count 23 3 26 Expected count 17.7 8.3 26.0
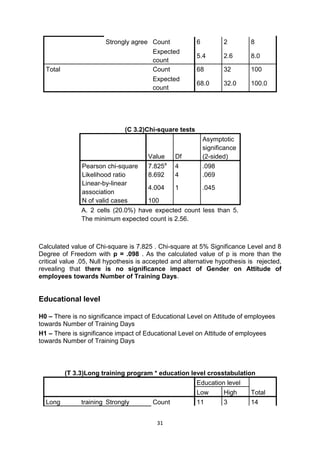
  • 31. 31 Strongly agree Count 6 2 8 Expected count 5.4 2.6 8.0 Total Count 68 32 100 Expected count 68.0 32.0 100.0 (C 3.2)Chi-square tests Value Df Asymptotic significance (2-sided) Pearson chi-square 7.825a 4 .098 Likelihood ratio 8.692 4 .069 Linear-by-linear association 4.004 1 .045 N of valid cases 100 A. 2 cells (20.0%) have expected count less than 5. The minimum expected count is 2.56. Calculated value of Chi-square is 7.825 . Chi-square at 5% Significance Level and 8 Degree of Freedom with p = .098 . As the calculated value of p is more than the critical value .05, Null hypothesis is accepted and alternative hypothesis is rejected, revealing that there is no significance impact of Gender on Attitude of employees towards Number of Training Days. Educational level H0 – There is no significance impact of Educational Level on Attitude of employees towards Number of Training Days H1 – There is significance impact of Educational Level on Attitude of employees towards Number of Training Days (T 3.3)Long training program * education level crosstabulation Education level TotalLow High Long training Strongly Count 11 3 14
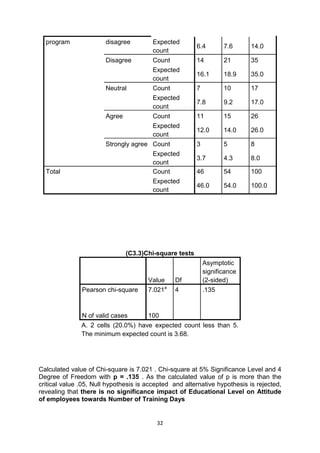
  • 32. 32 program disagree Expected count 6.4 7.6 14.0 Disagree Count 14 21 35 Expected count 16.1 18.9 35.0 Neutral Count 7 10 17 Expected count 7.8 9.2 17.0 Agree Count 11 15 26 Expected count 12.0 14.0 26.0 Strongly agree Count 3 5 8 Expected count 3.7 4.3 8.0 Total Count 46 54 100 Expected count 46.0 54.0 100.0 (C3.3)Chi-square tests Value Df Asymptotic significance (2-sided) Pearson chi-square 7.021a 4 .135 N of valid cases 100 A. 2 cells (20.0%) have expected count less than 5. The minimum expected count is 3.68. Calculated value of Chi-square is 7.021 . Chi-square at 5% Significance Level and 4 Degree of Freedom with p = .135 . As the calculated value of p is more than the critical value .05, Null hypothesis is accepted and alternative hypothesis is rejected, revealing that there is no significance impact of Educational Level on Attitude of employees towards Number of Training Days
  • 33. 33 Marital status H0 – There is no significance impact of Marital Status on Attitude of employees towards Number of Training Days H1 – There is significance impact of Marital Status on Attitude of employees towards Number of Training Days (T 3.4) Long training program * marital status crosstabulation Marital status TotalMarried Unmarrie d Long training program Strongly disagree Count 11 3 14 Expected count 9.2 4.8 14.0 Disagree Count 30 5 35 Expected count 23.1 11.9 35.0 Neutral Count 10 7 17 Expected count 11.2 5.8 17.0 Agree Count 12 14 26 Expected count 17.2 8.8 26.0 Strongly agree Count 3 5 8 Expected count 5.3 2.7 8.0 Total Count 66 34 100 Expected count 66.0 34.0 100.0
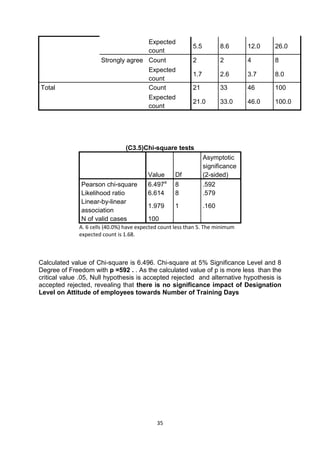
  • 34. 34 (C3.4)Chi-square tests Value Df Asymptotic significance (2-sided) Pearson chi-square 14.897a 4 .005 N of valid cases 100 A. 2 cells (20.0%) have expected count less than 5. The minimum expected count is 2.72. Calculated value of Chi-square is 14.897 . Chi-square at 5% Significance Level and 4 Degree of Freedom with p =005 . . As the calculated value of p is less than the critical value .05, Null hypothesis is rejected and alternative hypothesis is accepted, revealing that there is significance impact of Marital Status on Attitude of employees towards Number of Training Days Designation H0 – There is no significance impact of Designation Level on Attitude of employees towards Number of Training Days H1 – There is significance impact of Designation Level on Attitude of employees towards Number of Training Days (T3.5)Long training program * designation level cross tabulation Designation level TotalBottom Middle Top Long training program Strongly disagree Count 3 7 4 14 Expected count 2.9 4.6 6.4 14.0 Disagree Count 9 13 13 35 Expected count 7.4 11.6 16.1 35.0 Neutral Count 2 5 10 17 Expected count 3.6 5.6 7.8 17.0 Agree Count 5 6 15 26
  • 35. 35 Expected count 5.5 8.6 12.0 26.0 Strongly agree Count 2 2 4 8 Expected count 1.7 2.6 3.7 8.0 Total Count 21 33 46 100 Expected count 21.0 33.0 46.0 100.0 (C3.5)Chi-square tests Value Df Asymptotic significance (2-sided) Pearson chi-square 6.497a 8 .592 Likelihood ratio 6.614 8 .579 Linear-by-linear association 1.979 1 .160 N of valid cases 100 A. 6 cells (40.0%) have expected count less than 5. The minimum expected count is 1.68. Calculated value of Chi-square is 6.496. Chi-square at 5% Significance Level and 8 Degree of Freedom with p =592 . . As the calculated value of p is more less than the critical value .05, Null hypothesis is accepted rejected and alternative hypothesis is accepted rejected, revealing that there is no significance impact of Designation Level on Attitude of employees towards Number of Training Days
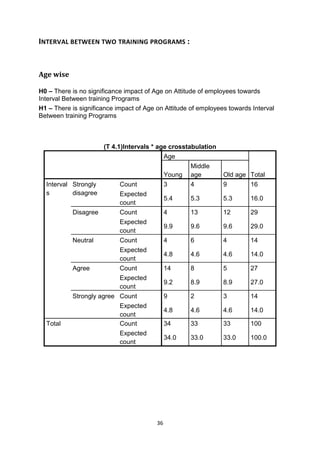
  • 36. 36 INTERVAL BETWEEN TWO TRAINING PROGRAMS : Age wise H0 – There is no significance impact of Age on Attitude of employees towards Interval Between training Programs H1 – There is significance impact of Age on Attitude of employees towards Interval Between training Programs (T 4.1)Intervals * age crosstabulation Age TotalYoung Middle age Old age Interval s Strongly disagree Count 3 4 9 16 Expected count 5.4 5.3 5.3 16.0 Disagree Count 4 13 12 29 Expected count 9.9 9.6 9.6 29.0 Neutral Count 4 6 4 14 Expected count 4.8 4.6 4.6 14.0 Agree Count 14 8 5 27 Expected count 9.2 8.9 8.9 27.0 Strongly agree Count 9 2 3 14 Expected count 4.8 4.6 4.6 14.0 Total Count 34 33 33 100 Expected count 34.0 33.0 33.0 100.0
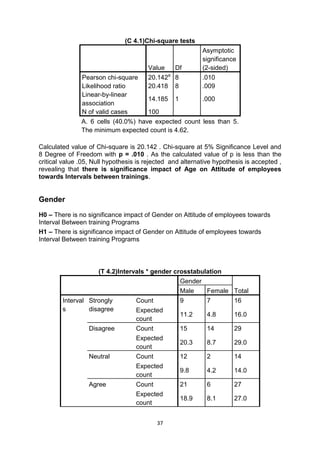
  • 37. 37 (C 4.1)Chi-square tests Value Df Asymptotic significance (2-sided) Pearson chi-square 20.142a 8 .010 Likelihood ratio 20.418 8 .009 Linear-by-linear association 14.185 1 .000 N of valid cases 100 A. 6 cells (40.0%) have expected count less than 5. The minimum expected count is 4.62. Calculated value of Chi-square is 20.142 . Chi-square at 5% Significance Level and 8 Degree of Freedom with p = .010 . As the calculated value of p is less than the critical value .05, Null hypothesis is rejected and alternative hypothesis is accepted , revealing that there is significance impact of Age on Attitude of employees towards Intervals between trainings. Gender H0 – There is no significance impact of Gender on Attitude of employees towards Interval Between training Programs H1 – There is significance impact of Gender on Attitude of employees towards Interval Between training Programs (T 4.2)Intervals * gender crosstabulation Gender TotalMale Female Interval s Strongly disagree Count 9 7 16 Expected count 11.2 4.8 16.0 Disagree Count 15 14 29 Expected count 20.3 8.7 29.0 Neutral Count 12 2 14 Expected count 9.8 4.2 14.0 Agree Count 21 6 27 Expected count 18.9 8.1 27.0
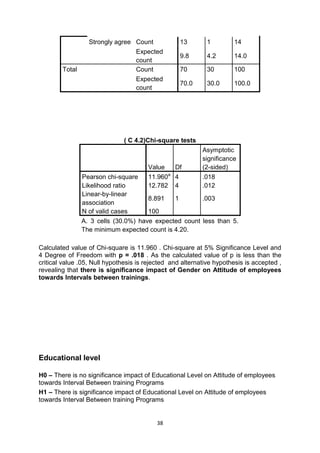
  • 38. 38 Strongly agree Count 13 1 14 Expected count 9.8 4.2 14.0 Total Count 70 30 100 Expected count 70.0 30.0 100.0 ( C 4.2)Chi-square tests Value Df Asymptotic significance (2-sided) Pearson chi-square 11.960a 4 .018 Likelihood ratio 12.782 4 .012 Linear-by-linear association 8.891 1 .003 N of valid cases 100 A. 3 cells (30.0%) have expected count less than 5. The minimum expected count is 4.20. Calculated value of Chi-square is 11.960 . Chi-square at 5% Significance Level and 4 Degree of Freedom with p = .018 . As the calculated value of p is less than the critical value .05, Null hypothesis is rejected and alternative hypothesis is accepted , revealing that there is significance impact of Gender on Attitude of employees towards Intervals between trainings. Educational level H0 – There is no significance impact of Educational Level on Attitude of employees towards Interval Between training Programs H1 – There is significance impact of Educational Level on Attitude of employees towards Interval Between training Programs
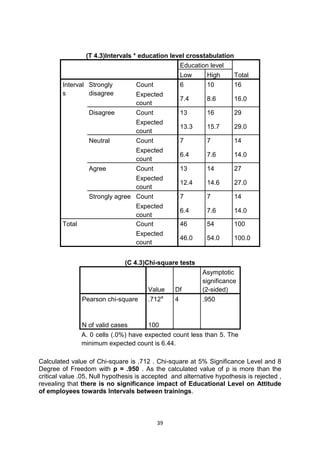
  • 39. 39 (T 4.3)Intervals * education level crosstabulation Education level TotalLow High Interval s Strongly disagree Count 6 10 16 Expected count 7.4 8.6 16.0 Disagree Count 13 16 29 Expected count 13.3 15.7 29.0 Neutral Count 7 7 14 Expected count 6.4 7.6 14.0 Agree Count 13 14 27 Expected count 12.4 14.6 27.0 Strongly agree Count 7 7 14 Expected count 6.4 7.6 14.0 Total Count 46 54 100 Expected count 46.0 54.0 100.0 (C 4.3)Chi-square tests Value Df Asymptotic significance (2-sided) Pearson chi-square .712a 4 .950 N of valid cases 100 A. 0 cells (.0%) have expected count less than 5. The minimum expected count is 6.44. Calculated value of Chi-square is .712 . Chi-square at 5% Significance Level and 8 Degree of Freedom with p = .950 . As the calculated value of p is more than the critical value .05, Null hypothesis is accepted and alternative hypothesis is rejected , revealing that there is no significance impact of Educational Level on Attitude of employees towards Intervals between trainings.
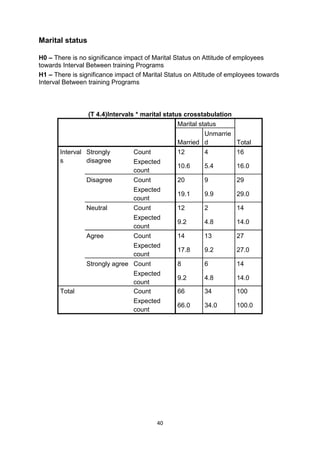
  • 40. 40 Marital status H0 – There is no significance impact of Marital Status on Attitude of employees towards Interval Between training Programs H1 – There is significance impact of Marital Status on Attitude of employees towards Interval Between training Programs (T 4.4)Intervals * marital status crosstabulation Marital status TotalMarried Unmarrie d Interval s Strongly disagree Count 12 4 16 Expected count 10.6 5.4 16.0 Disagree Count 20 9 29 Expected count 19.1 9.9 29.0 Neutral Count 12 2 14 Expected count 9.2 4.8 14.0 Agree Count 14 13 27 Expected count 17.8 9.2 27.0 Strongly agree Count 8 6 14 Expected count 9.2 4.8 14.0 Total Count 66 34 100 Expected count 66.0 34.0 100.0
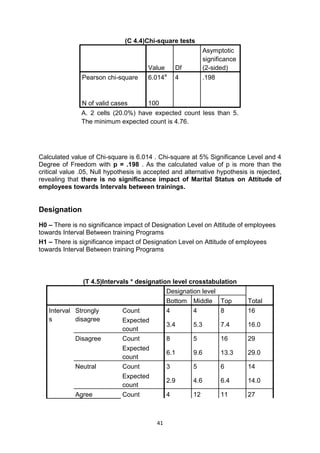
  • 41. 41 (C 4.4)Chi-square tests Value Df Asymptotic significance (2-sided) Pearson chi-square 6.014a 4 .198 N of valid cases 100 A. 2 cells (20.0%) have expected count less than 5. The minimum expected count is 4.76. Calculated value of Chi-square is 6.014 . Chi-square at 5% Significance Level and 4 Degree of Freedom with p = .198 . As the calculated value of p is more than the critical value .05, Null hypothesis is accepted and alternative hypothesis is rejected, revealing that there is no significance impact of Marital Status on Attitude of employees towards Intervals between trainings. Designation H0 – There is no significance impact of Designation Level on Attitude of employees towards Interval Between training Programs H1 – There is significance impact of Designation Level on Attitude of employees towards Interval Between training Programs (T 4.5)Intervals * designation level crosstabulation Designation level TotalBottom Middle Top Interval s Strongly disagree Count 4 4 8 16 Expected count 3.4 5.3 7.4 16.0 Disagree Count 8 5 16 29 Expected count 6.1 9.6 13.3 29.0 Neutral Count 3 5 6 14 Expected count 2.9 4.6 6.4 14.0 Agree Count 4 12 11 27
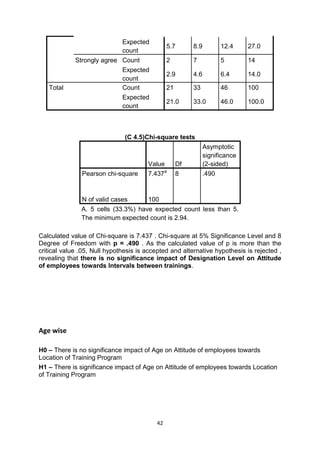
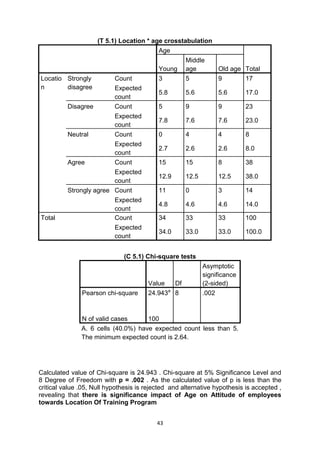
  • 42. 42 Expected count 5.7 8.9 12.4 27.0 Strongly agree Count 2 7 5 14 Expected count 2.9 4.6 6.4 14.0 Total Count 21 33 46 100 Expected count 21.0 33.0 46.0 100.0 (C 4.5)Chi-square tests Value Df Asymptotic significance (2-sided) Pearson chi-square 7.437a 8 .490 N of valid cases 100 A. 5 cells (33.3%) have expected count less than 5. The minimum expected count is 2.94. Calculated value of Chi-square is 7.437 . Chi-square at 5% Significance Level and 8 Degree of Freedom with p = .490 . As the calculated value of p is more than the critical value .05, Null hypothesis is accepted and alternative hypothesis is rejected , revealing that there is no significance impact of Designation Level on Attitude of employees towards Intervals between trainings. Age wise H0 – There is no significance impact of Age on Attitude of employees towards Location of Training Program H1 – There is significance impact of Age on Attitude of employees towards Location of Training Program
  • 43. 43 (T 5.1) Location * age crosstabulation Age TotalYoung Middle age Old age Locatio n Strongly disagree Count 3 5 9 17 Expected count 5.8 5.6 5.6 17.0 Disagree Count 5 9 9 23 Expected count 7.8 7.6 7.6 23.0 Neutral Count 0 4 4 8 Expected count 2.7 2.6 2.6 8.0 Agree Count 15 15 8 38 Expected count 12.9 12.5 12.5 38.0 Strongly agree Count 11 0 3 14 Expected count 4.8 4.6 4.6 14.0 Total Count 34 33 33 100 Expected count 34.0 33.0 33.0 100.0 (C 5.1) Chi-square tests Value Df Asymptotic significance (2-sided) Pearson chi-square 24.943a 8 .002 N of valid cases 100 A. 6 cells (40.0%) have expected count less than 5. The minimum expected count is 2.64. Calculated value of Chi-square is 24.943 . Chi-square at 5% Significance Level and 8 Degree of Freedom with p = .002 . As the calculated value of p is less than the critical value .05, Null hypothesis is rejected and alternative hypothesis is accepted , revealing that there is significance impact of Age on Attitude of employees towards Location Of Training Program
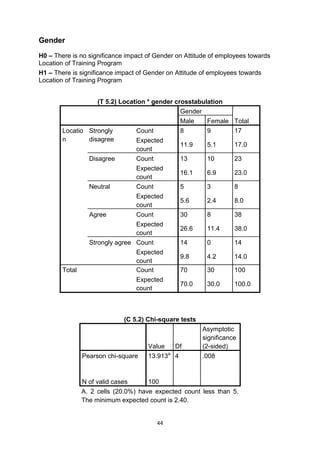
  • 44. 44 Gender H0 – There is no significance impact of Gender on Attitude of employees towards Location of Training Program H1 – There is significance impact of Gender on Attitude of employees towards Location of Training Program (T 5.2) Location * gender crosstabulation Gender TotalMale Female Locatio n Strongly disagree Count 8 9 17 Expected count 11.9 5.1 17.0 Disagree Count 13 10 23 Expected count 16.1 6.9 23.0 Neutral Count 5 3 8 Expected count 5.6 2.4 8.0 Agree Count 30 8 38 Expected count 26.6 11.4 38.0 Strongly agree Count 14 0 14 Expected count 9.8 4.2 14.0 Total Count 70 30 100 Expected count 70.0 30.0 100.0 (C 5.2) Chi-square tests Value Df Asymptotic significance (2-sided) Pearson chi-square 13.913a 4 .008 N of valid cases 100 A. 2 cells (20.0%) have expected count less than 5. The minimum expected count is 2.40.
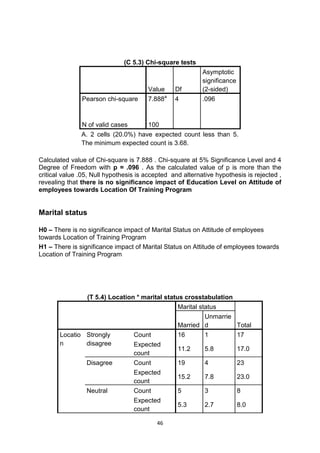
  • 45. 45 Calculated value of Chi-square is 13.913 . Chi-square at 5% Significance Level and 8 Degree of Freedom with p = .008 . As the calculated value of p is less than the critical value .05, Null hypothesis is rejected and alternative hypothesis is accepted , revealing that there is significance impact of Gender on Attitude of employees towards Location Of Training Program Educational level H0 – There is no significance impact of Educational Level on Attitude of employees towards Location of Training Program H1 – There is significance impact of Educational Level on Attitude of employees towards Location of Training Program (T 5.3) Location * education level crosstabulation Education level TotalLow High Locatio n Strongly disagree Count 10 7 17 Expected count 7.8 9.2 17.0 Disagree Count 14 9 23 Expected count 10.6 12.4 23.0 Neutral Count 5 3 8 Expected count 3.7 4.3 8.0 Agree Count 13 25 38 Expected count 17.5 20.5 38.0 Strongly agree Count 4 10 14 Expected count 6.4 7.6 14.0 Total Count 46 54 100 Expected count 46.0 54.0 100.0
  • 46. 46 (C 5.3) Chi-square tests Value Df Asymptotic significance (2-sided) Pearson chi-square 7.888a 4 .096 N of valid cases 100 A. 2 cells (20.0%) have expected count less than 5. The minimum expected count is 3.68. Calculated value of Chi-square is 7.888 . Chi-square at 5% Significance Level and 4 Degree of Freedom with p = .096 . As the calculated value of p is more than the critical value .05, Null hypothesis is accepted and alternative hypothesis is rejected , revealing that there is no significance impact of Education Level on Attitude of employees towards Location Of Training Program Marital status H0 – There is no significance impact of Marital Status on Attitude of employees towards Location of Training Program H1 – There is significance impact of Marital Status on Attitude of employees towards Location of Training Program (T 5.4) Location * marital status crosstabulation Marital status TotalMarried Unmarrie d Locatio n Strongly disagree Count 16 1 17 Expected count 11.2 5.8 17.0 Disagree Count 19 4 23 Expected count 15.2 7.8 23.0 Neutral Count 5 3 8 Expected count 5.3 2.7 8.0
  • 47. 47 Agree Count 21 17 38 Expected count 25.1 12.9 38.0 Strongly agree Count 5 9 14 Expected count 9.2 4.8 14.0 Total Count 66 34 100 Expected count 66.0 34.0 100.0 (C 5.4) Chi-square tests Value Df Asymptotic significance (2-sided) Pearson chi-square 16.535a 4 .002 Likelihood ratio 18.255 4 .001 Linear-by-linear association 16.117 1 .000 N of valid cases 100 A. 2 cells (20.0%) have expected count less than 5. The minimum expected count is 2.72. Calculated value of Chi-square is 16.535. Chi-square at 5% Significance Level and 4 Degree of Freedom with p = .002 . As the calculated value of p is less than the critical value .05, Null hypothesis is rejected and alternative hypothesis is accepted , revealing that there is significance impact of Marital Status on Attitude of employees towards Location Of Training Program Designation H0 – There is no significance impact of Designation Level on Attitude of employees towards Location of Training Program H1 – There is significance impact of Designation Level on Attitude of employees towards Location of Training Program
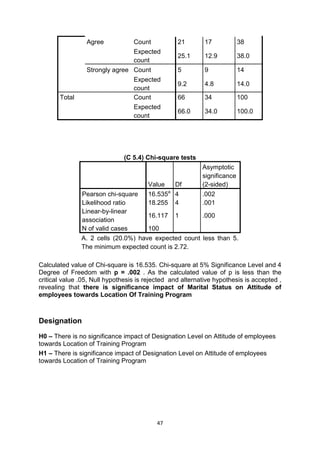
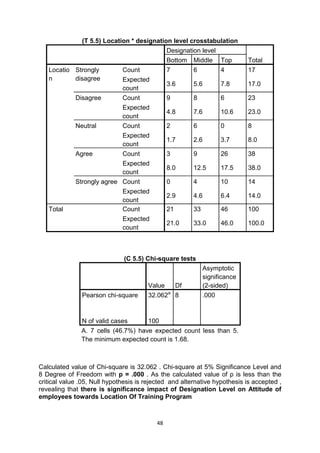
  • 48. 48 (T 5.5) Location * designation level crosstabulation Designation level TotalBottom Middle Top Locatio n Strongly disagree Count 7 6 4 17 Expected count 3.6 5.6 7.8 17.0 Disagree Count 9 8 6 23 Expected count 4.8 7.6 10.6 23.0 Neutral Count 2 6 0 8 Expected count 1.7 2.6 3.7 8.0 Agree Count 3 9 26 38 Expected count 8.0 12.5 17.5 38.0 Strongly agree Count 0 4 10 14 Expected count 2.9 4.6 6.4 14.0 Total Count 21 33 46 100 Expected count 21.0 33.0 46.0 100.0 (C 5.5) Chi-square tests Value Df Asymptotic significance (2-sided) Pearson chi-square 32.062a 8 .000 N of valid cases 100 A. 7 cells (46.7%) have expected count less than 5. The minimum expected count is 1.68. Calculated value of Chi-square is 32.062 . Chi-square at 5% Significance Level and 8 Degree of Freedom with p = .000 . As the calculated value of p is less than the critical value .05, Null hypothesis is rejected and alternative hypothesis is accepted , revealing that there is significance impact of Designation Level on Attitude of employees towards Location Of Training Program
  • 49. 49 FINDINGS  There is significant impact of Employee’s age on their attitude towards Importance of Training.  There is significance impact of Marital Status on Attitude of employees Towards Importance of Training  There is significance impact of Age on Attitude of employees towards Training Hours per Day  There is significance impact of Gender on Attitude of employees towards Training Hours per Day  There is significance impact of Educational on Attitude of employees towards Training Hours per Day  There is significance impact of Marital Status on Attitude of employees towards Training Hours per Day  There is significance impact of Marital Status on Attitude of employees towards Number of Training Days  There is significance impact of Age on Attitude of employees towards Intervals between Trainings.  There is significance impact of Gender on Attitude of employees towards Intervals between Trainings.  There is significance impact of Age on Attitude of employees towards Location Of Training Program  There is significance impact of Gender on Attitude of employees towards Location Of Training Program  There is significance impact of Marital Status on Attitude of employees towards Location Of Training Program  There is significance impact of Designation Level on Attitude of employees towards Location Of Training Program  There is no significant impact of Gender of employees on their attitude towards Importance of Training.  There is no significance impact of Educational Level on Attitude of employees towards Importance of Training
  • 50. 50  There is no significance impact of Designation Level on Attitude of employees towards Importance of Training  There is no significance impact of Designation Level on Attitude of employees towards Training Hours per Day  There is no significance impact of on Attitude of Gender employees towards Number of Training Days.  There is no significance impact of Educational Level on Attitude of employees towards Number of Training Days  There is no significance impact of on Attitude of employees towards Number of Training Days  There is no significance impact of Educational Level on Attitude of employees towards Intervals between Trainings  There is no significance impact of Marital Status on Attitude of employees towards Intervals between Trainings.  There is no significance impact of Designation Level on Attitude of employees towards Intervals between Trainings.  There is no significance impact of Education Level on Attitude of employees towards Location Of Training Program
  • 51. 51 Conclusion This study concludes that each employee have different attitude towards different factors of training program. Attitude of employees are influenced by many factors which includes demographic factors too. As seen in the study, when employees were grouped demographically, they showed similar characteristics with employees of their own group and different characteristics from other groups. Training and Development have advantages not only for employee but the ultimate benefit is for the organization itself. If the performance of the employee is not good it will affect the whole organization. The demographic factors such as age, gender, educational qualifications, marital status and designation contribute towards attitude formation of the employees towards Training Program. Age of employee impact their attitude towards importance of training, training hours per day, Intervals between trainings, Location Of Training Program. Gender of employee impact their attitude towards Training Hours per Day, Intervals between trainings, Location of Training Program. Educational Level of employee impact their attitude towards Training Hours per Day. Marital Status of employee impacts their attitude towards Importance of Training, Training Hours per Day, Number of Training Days, Location Of Training Program. Designation of employee impacts their attitude towards Location Of Training Program. So to design an effecting Training program the HR department must consider the demographic background of their employees along with other factors.
  • 52. 52 Recommendations  The results of the study can be utilized by practitioners in relooking or revamping their strategies for designing Training Programs  HR department should study negative attitude of employees towards training and direct it towards better direction  As demographic factor of employees affect how employees perceive training, it should be considered while designing training programs  Difference in attitude by different demographic group should be used to make training program more effective  On basis of how employees perceive training, they should be educated towards importance of training program as its factors  Training hours per day for employees of elderly age should be reduced  Location of training for Female employees should not be kept much away from their place of living/working  Less educated employees should be educated towards importance of training and its effect on individual and on organisation  Married Employees’ Training Location should be kept near and if not, of less days  To design an effecting Training program the HR department must consider the demographic background of their employees along with other factors.
  • 53. 53 Limitations  The study do not undertake emotional and personal characteristics of employees which too impact the formation of attitude  Study is a sample study and hence do not represent exact attitude of each and every employee of population  Study do not undertake impact of nearby environment of employee which may affect their attitude  Convenience method of sample selection was done therefore probabilistic sampling could not be assigned  Question were asked indirectly and are translated therefore exact attitude of employee could be misjudged  5 pointed Likert scale was used which is less expressive than a 7 pointed Likert scale
  • 54. 54 References 1. Muhammad zahid iqbal, et.al., (2011). An empirical analysis of the relationship between characteristics and formative evaluation of training. The international journal of business research 4 (1): 273-86. 2. Eugen rotarescu, (2010). Alternative selection under risk conditions in human resource training and development through the application of the estimated monetary value and decision tree analysis. Journal of management and economics 4 (60): 468-75. 3 pilar pineda, (2010). Evaluation of training in organizations: a proposal for an integrated model. Journal of european industrial training 34(7): 673-93. 4. Cary cherniss, et.al., (2010). Process-designed training: a new approach for helping leaders develop emotional and social competence. Journal of management development 29(5): 413-31. 5. Thomas andersson, (2010). Struggles of managerial being and becoming: experiences from managers’ personal development training. Journal of management development 29(2): 167-76. 6. David mcguire and mammed bagher, (2010). Diversity training in organisations: an introduction. Journal of european industrial training 34 (6): 493-505. 7. Cody b. Cox and margaret e. Beier, (2009). The moderating effect of individual differences on the relationship between the framing of training and interest in training. The international journal training and development 13(4): 247-60. 8. Franco gandolfi, (2009). Training and development in an era of downsizing. Journal of management research 9(1): 314. 9. David pollitt, (2009). Training team shines at axa sun life. Journal of human resource management international digest 17(5): 23-24. 10. David pollitt, (2009). Thomson reuters maps new relationships in learning and collaboration. Journal of human resource management international digest 17(4): 24-6.