eicher valuation final
2 likes•3,018 views

This document provides an analysis of the Indian automobile industry. It begins with an overview noting that the Indian automobile industry has grown at a phenomenal 12% CAGR compared to the world average of -1%. It then discusses factors like the economy, performs a SWOT analysis and Porter's Five Forces analysis. It breaks the industry down into segments like two-wheelers, commercial vehicles, and passenger vehicles. For each segment it discusses the major players, market shares and outlook. It then focuses on Eicher Motors Ltd as the company in focus, providing background, historical financials, projections, and valuation to arrive at a final price per share.
![Valuation
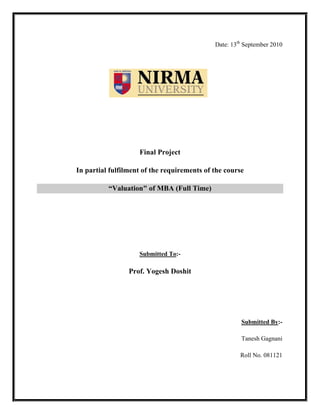
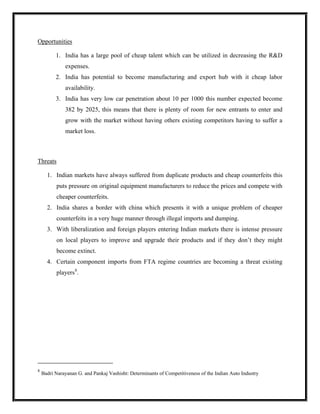
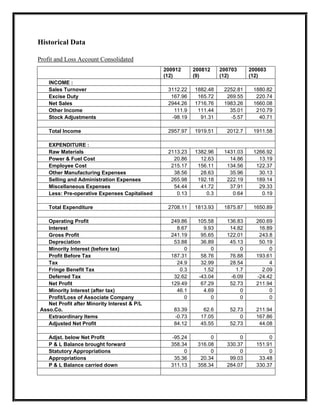
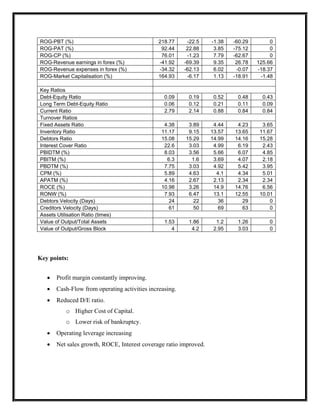
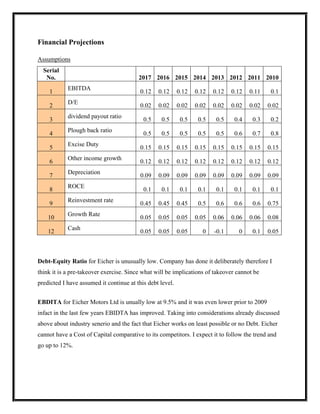
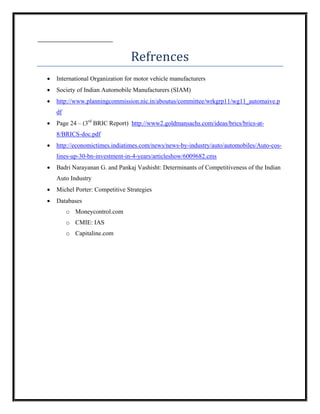
To value Eicher Motors Ltd. Free Cash Flow to Firm Method is used and above given Profit and
Loss statement and Balance Sheet are used in conjugation with the assumptions following
cashfow is prepared.
FCFF
Avalible
Projected Projected Projected Projected
Data
particulars 201312 201212 201112 201012 200912
EBIT(1-t) 234.248181 212.269097 192.462306 165.0804577 131.3066
Net Capital Expenditure[Capital
Expenditure- Depriciation] 29.30 28.24 21.64 -5.49 11.51
Change in Working Capital
Calculation of Growth
Rate(R.R*ROC) 9.00% 10.80% 10.80% 6.00% 8.24%
1) ROC 18.00% 18.00% 18.00% 10.00% 10.98%
EBIT(1-T) 234.25 212.27 192.46 165.08 131.31
Book Value of Equity&Debt 1259.742161 1170.138698 1066.054994 957.2088 1195.41
2) Reinvestment Rate 0.50 0.60 0.60 0.60 0.75
Capex 126.81 114.97 98.60 63.09 11.51
Change in WC 0.00 0.00 0.00 0.00 0.00
EBIT(1-T) 234.25 212.27 192.46 165.08 131.31
FCFF 263.55 240.51 214.10 159.59 142.82
WACC 0.11 0.11 0.11 0.11 0.11
Present value 176.48 178.04 158.49 130.60 129.19](https://image.slidesharecdn.com/081121eichervaluationfinal-130415050414-phpapp02/85/eicher-valuation-final-49-320.jpg)
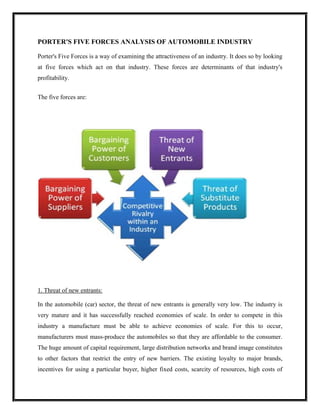
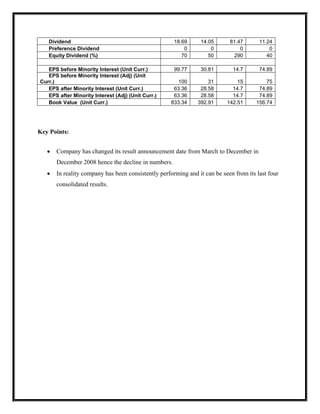
![Projected Projected Projected
particulars 201612 201512 201412
EBIT(1-t) 296.1081482 274.5216053 254.568314
Net Capital Expenditure[Capital
Expenditure- Depreciation] -4.56 -3.04 9.21
Change in Working Capital
Calculation of Growth
Rate(R.R*ROC) 8.10% 8.10% 8.10%
1) ROC 18.00% 18.00% 18.00%
EBIT(1-T) 296.11 274.52 254.57
Book Value of Equity&Debt 1582.005215 1466.107834 1358.634018
2) Reinvestment Rate 0.45 0.45 0.45
Capex 123.02 114.07 116.63
Change in WC 0.00 0.00 0.00
EBIT(1-T) 296.11 274.52 254.57
FCFF 291.55 271.48 263.77
WACC 0.11 0.11 0.11
Present value 144.52 148.76 159.78](https://image.slidesharecdn.com/081121eichervaluationfinal-130415050414-phpapp02/85/eicher-valuation-final-50-320.jpg)
eicher valuation final
- 1. Date: 13th September 2010 Final Project In partial fulfilment of the requirements of the course “Valuation" of MBA (Full Time) Submitted To:- Prof. Yogesh Doshit Submitted By:- Tanesh Gagnani Roll No. 081121
- 2. Abstract Indian automobile industry has grown at phenomenal rate of almost 12% CAGR while the world average for the same period has been negative 1. With experts like Mckinsey sticking sticking their neck out and saying that Indian’s car penetration will go up from present 7 per thousand to 363 per thousand. A huge growth is expected in this sector which will be fuelled by economic growth driven by consumption. After that SWOT and 5 Force analysis is done on sector keeping a global view. Sector is broken up into major industries; passenger car, Two Wheelers, Commercial Vehicles continuing with a detail study of each one of them including major players ,performance in the last year and an estimate of what is installed for them in the coming year. A study of Commercial Vehicles this is given special importance since Eicher Motors Ltd. being valued belongs to this group. This year the government has kept the freight duty same therefore HCV will get a boost. Financing will be cheaper in the coming year hence across the segment sales are expected to increase. Finally historical data for Eicher Motors Ltd. assumptions about growth and affecter factors, projected Profit and Loss, Balance Sheet, valuation methodology, final valuation figure of price per share.
- 3. Index OBJECTIVE................................................................................................................................................ 6 LIMITATIONS .......................................................................................................................................... 7 AUTOMOBILE SECTOR ......................................................................................................................... 8 Overview ........................................................................................................................................................... 8 Economy as a Factor ......................................................................................................................................... 11 SWOT- Analysis ................................................................................................................................................. 12 Strengths ................................................................................................................................................................. 12 Weakness ................................................................................................................................................................ 12 Opportunities .......................................................................................................................................................... 13 Threats .................................................................................................................................................................... 13 PORTER'S FIVE FORCES ANALYSIS OF AUTOMOBILE INDUSTRY .......................................................................... 14 1. Threat of new entrants: ...................................................................................................................................... 14 2. Bargaining power of buyers/customers:............................................................................................................. 15 3. Bargaining Power Of Suppliers: .......................................................................................................................... 15 4. Threat of substitute products: ............................................................................................................................ 16 5. Intensity of rivalry among competitors: ............................................................................................................. 16 Key Certainty........................................................................................................................................................... 17 Key Uncertainty: ..................................................................................................................................................... 17 Key Success Factors: ............................................................................................................................................... 17 INDUSTRY BREAKUP .......................................................................................................................... 18 Two Wheelers Segment .................................................................................................................................... 19 Scooters .................................................................................................................................................................. 21 Motorcycles ............................................................................................................................................................ 22 Three Wheeler Segment.................................................................................................................................... 23
- 4. Passenger Vehicles Segment ............................................................................................................................. 24 Passenger Cars ........................................................................................................................................................ 26 Utility Vehicle .......................................................................................................................................................... 26 Multi Purpose Vehicle (MPV) .................................................................................................................................. 26 COMMERCIAL VEHICLES ................................................................................................................... 27 Introduction...................................................................................................................................................... 27 Current Scenario and Prospects ......................................................................................................................... 28 Upturn and improved financing environment driving recovery in CV segment ..................................................... 29 Greater credit availability and lower financing costs help improve financing environment .................................. 30 Freight rates remain flat; hinge on further improvement in economic activity ..................................................... 31 Outlook for Commercial Vehicles segment ........................................................................................................ 32 STRUCTURE OF THE INDIAN COMMERCIAL VEHICLE INDUSTRY ....................................... 33 MARKET SHARE ................................................................................................................................... 35 COMPANY IN FOCUS: EICHER MOTORS LTD. .............................................................................. 38 Background....................................................................................................................................................... 38 Competitive Strength ........................................................................................................................................ 40 HISTORICAL DATA .............................................................................................................................. 41 Profit and Loss Account Consolidated .................................................................................................................... 41 Balance Sheet: Consolidated .................................................................................................................................. 43 Key Financial Ratios ................................................................................................................................................ 44 FINANCIAL PROJECTIONS ................................................................................................................. 46 Assumptions ........................................................................................................................................................... 46 Projected Profit and Loss (Abstract) ....................................................................................................................... 47 Projected Balance Sheet (Abstract) ........................................................................................................................ 48
- 5. VALUATION ........................................................................................................................................... 49 FCFF......................................................................................................................................................................... 49 FINAL CALL ON THE STOCK ............................................................................................................. 51 ANNEXURE-I .......................................................................................................................................... 52 ANNEXURE – II ...................................................................................................................................... 53 Automobile Export Trends ...................................................................................................................................... 53 ANNEXURE –III ..................................................................................................................................... 54 Market Share commercial Vehicles ........................................................................................................................ 54
- 6. Objective This report is valuation exercise so as to use the models in learned course ‘valuation’ and in doing that learning the process of valuing a company.
- 7. Limitations Since the most of the information used to prepare report was available in public domain for free, which means I had to make a lot of assumptions and on top of it my inexperience in valuing a company, Hence the output of this report cannot be deemed to be very precise. Hence I do not recommend this report to be the basis of any investment decision.
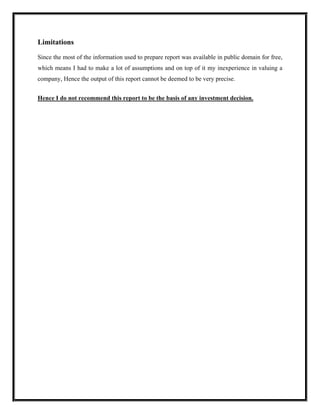
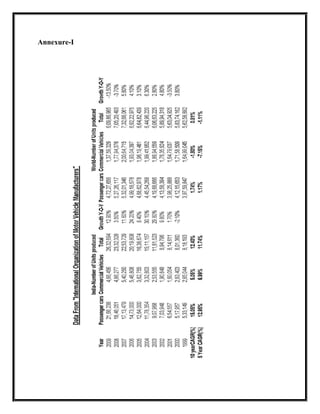
- 8. Automobile Sector Overview 14 12 10 8 5 year CAGR(%) 6 10 year CAGR(%) 4 2 0 Indian Automobile World Average for -2 Industry Automobile industry Comparison of growth of Automobile Sales in India and World Indian Automobile Industry is seventh largest in the world total production for 2009 being 26,32,694 1 units. India also is the fourth largest automobile exporter of automobiles. The performance figures for Indian Automobile industry have been exceptional, over the past 10 years from 2004 to 2009 the net production of automobiles in India has grown at a CAGR of 12.40% 2 (5 year CAGR for passenger Cars has been 15.05%). The importance of these figures increases even more if we consider the total unit increase in world automobile production has been at a 10 year CAGR of 0.81%. 1 International Organization of Motor Vehicle Manufacturers 2 Refer to Annexure- I
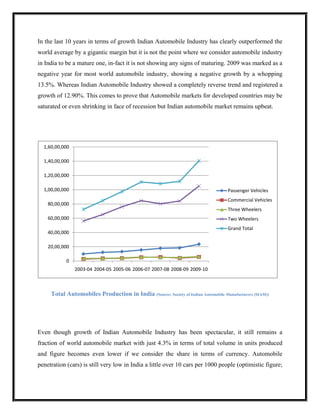
- 9. In the last 10 years in terms of growth Indian Automobile Industry has clearly outperformed the world average by a gigantic margin but it is not the point where we consider automobile industry in India to be a mature one, in-fact it is not showing any signs of maturing. 2009 was marked as a negative year for most world automobile industry, showing a negative growth by a whopping 13.5%. Whereas Indian Automobile Industry showed a completely reverse trend and registered a growth of 12.90%. This comes to prove that Automobile markets for developed countries may be saturated or even shrinking in face of recession but Indian automobile market remains upbeat. 1,60,00,000 1,40,00,000 1,20,00,000 1,00,00,000 Passenger Vehicles Commercial Vehicles 80,00,000 Three Wheelers 60,00,000 Two Wheelers Grand Total 40,00,000 20,00,000 0 2003-04 2004-05 2005-06 2006-07 2007-08 2008-09 2009-10 Total Automobiles Production in India (Source: Society of Indian Automobile Manufacturers (SIAM)) Even though growth of Indian Automobile Industry has been spectacular, it still remains a fraction of world automobile market with just 4.3% in terms of total volume in units produced and figure becomes even lower if we consider the share in terms of currency. Automobile penetration (cars) is still very low in India a little over 10 cars per 1000 people (optimistic figure;
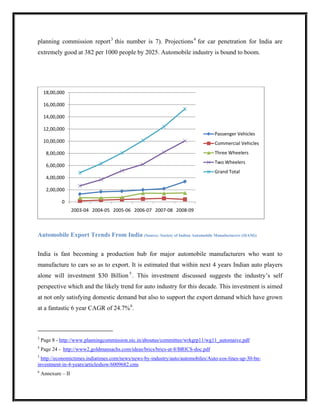
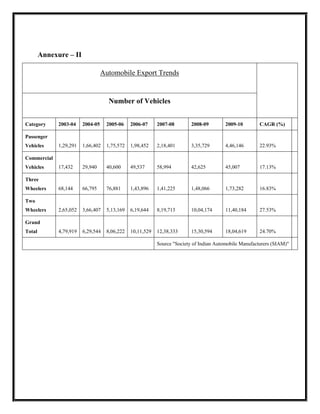
- 10. planning commission report 3 this number is 7). Projections 4 for car penetration for India are extremely good at 382 per 1000 people by 2025. Automobile industry is bound to boom. 18,00,000 16,00,000 14,00,000 12,00,000 Passenger Vehicles 10,00,000 Commercial Vehicles 8,00,000 Three Wheelers Two Wheelers 6,00,000 Grand Total 4,00,000 2,00,000 0 2003-04 2004-05 2005-06 2006-07 2007-08 2008-09 Automobile Export Trends From India (Source: Society of Indian Automobile Manufacturers (SIAM)) India is fast becoming a production hub for major automobile manufacturers who want to manufacture to cars so as to export. It is estimated that within next 4 years Indian auto players alone will investment $30 Billion 5 . This investment discussed suggests the industry’s self perspective which and the likely trend for auto industry for this decade. This investment is aimed at not only satisfying domestic demand but also to support the export demand which have grown at a fantastic 6 year CAGR of 24.7% 6. 3 Page 8 - http://www.planningcommission.nic.in/aboutus/committee/wrkgrp11/wg11_automaive.pdf 4 Page 24 - http://www2.goldmansachs.com/ideas/brics/brics-at-8/BRICS-doc.pdf 5 http://economictimes.indiatimes.com/news/news-by-industry/auto/automobiles/Auto-cos-lines-up-30-bn- investment-in-4-years/articleshow/6009682.cms 6 Annexure – II
- 11. Economy as a Factor Sale of Commercial Vehicles is backed by strong IIP numbers (17.6% YoY). This has created high growth expectations. Lot of new launches are expected this season with support of strong economic indicators growth seems certain. Margins which were under pressure due to strong steel prices will also improve as the steel prices have started to soften. There are some concerns on the possibility rising material prices and also there is a strong likelihood of a hike in interest rates. Given the increased competition in the small car segment it would become very difficult for players to pass this increased cost on to the consumers.
- 12. SWOT- Analysis Strengths 1. Indian Automobile Industry is globally cost competitive: It is possible because of cheap labor availability and tax holidays provided by SEZs. 2. Government support: Indian government has also put Auto among its priorities 7 with 2012 target to become 10% of our GDP. 3. Indian Automotive Industry is following global accepted quality measures at a lower cost. This makes it a perfect destination for production-outsourcing of automobiles. 4. The availability large talent pool at cheap prices. 5. Availability of cheap R&D; 4 IITs be deemed as centres of excellence for automobile research and access to latest technology. Weakness The biggest and probably the only weakness of Indian automobile Industry is its slow growth in Research and Development most companies (barring TATA and M&M) do not have adequate spending on R&D in comparison to their turnover. Maruti for instance is completely dependent upon Suzuki for any new technology all of the successful cars sold by it were developed by Suzuki; Swift, A-Star (which replaced alto in other markets as New Alto), SX4, Ritz etc. This weakness will soon become history as Indian companies are catching fast in R&D and are showing strong signs of success e.g.: M&M Scorpio Hybrid, TATA Nano. Besides R&D the other weakness is political hostility (TATA Nano Singur plant) but is only a regional problem of less developed states or pro-communist states, states like Gujarat, Maharashtra are proving to be a haven for Industries. 7 Page 26 - http://www.planningcommission.nic.in/aboutus/committee/wrkgrp11/wg11_automaive.pdf
- 13. Opportunities 1. India has a large pool of cheap talent which can be utilized in decreasing the R&D expenses. 2. India has potential to become manufacturing and export hub with it cheap labor availability. 3. India has very low car penetration about 10 per 1000 this number expected become 382 by 2025, this means that there is plenty of room for new entrants to enter and grow with the market without having others existing competitors having to suffer a market loss. Threats 1. Indian markets have always suffered from duplicate products and cheap counterfeits this puts pressure on original equipment manufacturers to reduce the prices and compete with cheaper counterfeits. 2. India shares a border with china which presents it with a unique problem of cheaper counterfeits in a very huge manner through illegal imports and dumping. 3. With liberalization and foreign players entering Indian markets there is intense pressure on local players to improve and upgrade their products and if they don’t they might become extinct. 4. Certain component imports from FTA regime countries are becoming a threat existing players 8. 8 Badri Narayanan G. and Pankaj Vashisht: Determinants of Competitiveness of the Indian Auto Industry
- 14. PORTER'S FIVE FORCES ANALYSIS OF AUTOMOBILE INDUSTRY Porter's Five Forces is a way of examining the attractiveness of an industry. It does so by looking at five forces which act on that industry. These forces are determinants of that industry's profitability. The five forces are: 1. Threat of new entrants: In the automobile (car) sector, the threat of new entrants is generally very low. The industry is very mature and it has successfully reached economies of scale. In order to compete in this industry a manufacture must be able to achieve economies of scale. For this to occur, manufacturers must mass-produce the automobiles so that they are affordable to the consumer. The huge amount of capital requirement, large distribution networks and brand image constitutes to other factors that restrict the entry of new barriers. The existing loyalty to major brands, incentives for using a particular buyer, higher fixed costs, scarcity of resources, high costs of
- 15. switching companies, and government regulations constituted the barriers to entry which in turn reduced the competition in auto industry. It costs a lot to set up a car manufacturing facility, a new firm may usually have a very low brand equity, legislation and government policy such as safety, EPA and emissions are very rigid and it takes quite a lot of time to establish a strong distribution network. 2. Bargaining power of buyers/customers: In the automobile sector, the buyers wield considerable power. The manufacturers depend on them to stay in business. If they cannot keep their buyers happy then they risk losing them to their competitors. The buyers have low switching cost if they are not happy. The automobile manufacturers are competing against each other on value, features, quality, style and customization to appeal to their customers. In the past when the economy was not liberalized, the car manufacturers themselves had much of the power, but with the entry of foreign companies after liberalization the power switched from SELLERS to BUYERS as the foreign manufacturers offered alternatives to domestic vehicles. However, the bargaining power with the buyers is MODERATELY high & not completely high, the reason being that the buyers are not large but few in number. Second, the buyers do not have the ability to integrate backwards into the industry, if they want a car then they have to purchase it from a car dealer only, they themselves won’t manufacture a car. 3. Bargaining Power Of Suppliers: In the automobile industry this refers to all the suppliers of parts, tires, components, electronics, and even the assembly line workers. To manufacture a car lots of different parts are required & to accomplish this there exist many suppliers. These suppliers rely on one or two automakers to buy a majority of their products. If an automaker decided to switch suppliers, it could be devastating to the previous supplier's business. As a result, suppliers are extremely susceptible to the demands and requirements of the automobile manufacturer and hold very little power.
- 16. 4. Threat of substitute products: The threat of substitutes to the automobile sector is fairly mild. There avail many other mode of transportation such as walking, cycling, taking a bus, train, rickshaw and to a larger extent an airplane or helicopter but none offer the utility, convenience, independence, and value afforded by automobiles. The switching costs associated with using a different mode of transportation, such as train, may be high in terms of personal time, convenience, and utility, but not necessarily monetarily the cost of fuel consumed on a similar round trip, daily parking, car insurance, and maintenance). Substitutes products all depend on the geographic location of the consumer. In places with high population densities (eg Mumbai), people prefer walking or cycling or taking a train, more rather than owing a car & keep waiting at signals for 2-long hours. On the contrary, there are people who would prefer to have at least one car for the “status” title in the society. 5. Intensity of rivalry among competitors: Rivalry among the competitors is very strong is this industry. Tit-for-tat price slashes, ad campaigns, and product developments keep them on the edge of innovation and profitability. One of the reasons for such high rivalry is the lack of differentiation opportunities. All the companies make cars (Sedans, Hatchbacks, and SUV’s). Before making any purchases the competitors are compared to one another constantly. As per me intensity of rivalry among competitors is the most important force in automobile industry. The price, quality, durability, and many other aspects of different manufacturers are greatly taken into consideration when deciding which Brand to purchase. For instance, in India market for sedans & coupe, companies like BMW, Audi & Mercedes are into fierce competition. The price & the features offered by BMW for its 3-series model are often compared to the price & the features of AUDI A-4 model & Mercedes C-class models. Similarly Skoda Fabia, Honda Jazz & Volkswagen Polo are being highly compared on features, performance & prices. Also the newly launched TATA NANO (the lowest price car) is extensively competing in price with Maruti-800, which was the lowest price available car before the launch of Nano.
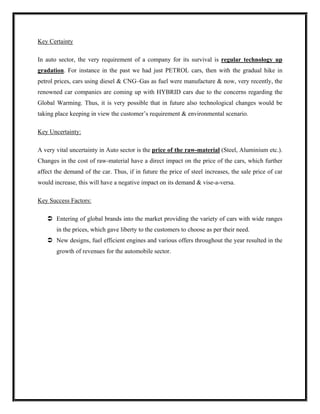
- 17. Key Certainty In auto sector, the very requirement of a company for its survival is regular technology up gradation. For instance in the past we had just PETROL cars, then with the gradual hike in petrol prices, cars using diesel & CNG–Gas as fuel were manufacture & now, very recently, the renowned car companies are coming up with HYBRID cars due to the concerns regarding the Global Warming. Thus, it is very possible that in future also technological changes would be taking place keeping in view the customer’s requirement & environmental scenario. Key Uncertainty: A very vital uncertainty in Auto sector is the price of the raw-material (Steel, Aluminium etc.). Changes in the cost of raw-material have a direct impact on the price of the cars, which further affect the demand of the car. Thus, if in future the price of steel increases, the sale price of car would increase, this will have a negative impact on its demand & vise-a-versa. Key Success Factors: Entering of global brands into the market providing the variety of cars with wide ranges in the prices, which gave liberty to the customers to choose as per their need. New designs, fuel efficient engines and various offers throughout the year resulted in the growth of revenues for the automobile sector.
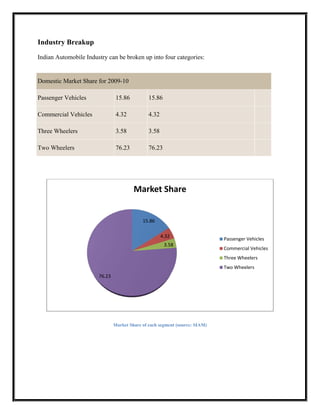
- 18. Industry Breakup Indian Automobile Industry can be broken up into four categories: Domestic Market Share for 2009-10 Passenger Vehicles 15.86 15.86 Commercial Vehicles 4.32 4.32 Three Wheelers 3.58 3.58 Two Wheelers 76.23 76.23 Market Share 15.86 4.32 Passenger Vehicles 3.58 Commercial Vehicles Three Wheelers Two Wheelers 76.23 Market Share of each segment (source: SIAM)
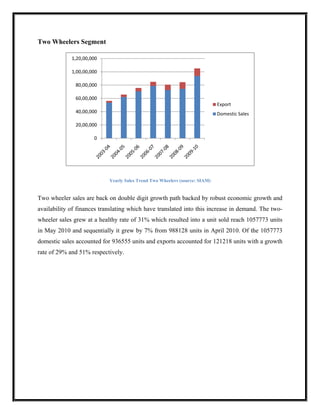
- 19. Two Wheelers Segment 1,20,00,000 1,00,00,000 80,00,000 60,00,000 Export 40,00,000 Domestic Sales 20,00,000 0 Yearly Sales Trend Two Wheelers (source: SIAM) Two wheeler sales are back on double digit growth path backed by robust economic growth and availability of finances translating which have translated into this increase in demand. The two- wheeler sales grew at a healthy rate of 31% which resulted into a unit sold reach 1057773 units in May 2010 and sequentially it grew by 7% from 988128 units in April 2010. Of the 1057773 domestic sales accounted for 936555 units and exports accounted for 121218 units with a growth rate of 29% and 51% respectively.
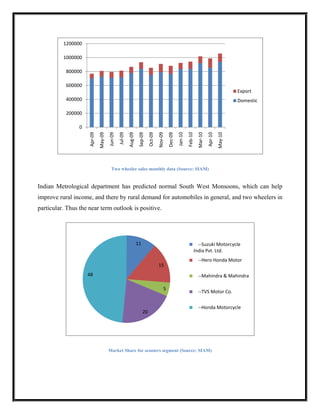
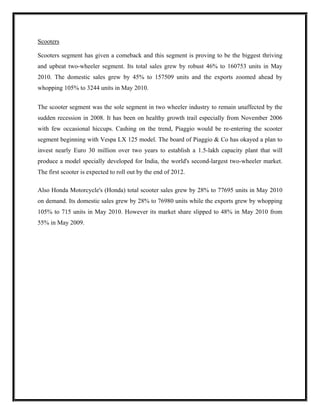
- 20. 1200000 1000000 800000 600000 Export 400000 Domestic 200000 0 Apr-09 May-09 Jun-09 Aug-09 Dec-09 Jul-09 Sep-09 Oct-09 Nov-09 Apr-10 May-10 Jan-10 Mar-10 Feb-10 Two wheeler sales monthly data (Source: SIAM) Indian Metrological department has predicted normal South West Monsoons, which can help improve rural income, and there by rural demand for automobiles in general, and two wheelers in particular. Thus the near term outlook is positive. 11 --Suzuki Motorcycle India Pvt. Ltd. --Hero Honda Motor 15 48 --Mahindra & Mahindra 5 --TVS Motor Co. --Honda Motorcycle 20 Market Share for scooters segment (Source: SIAM)
- 21. Scooters Scooters segment has given a comeback and this segment is proving to be the biggest thriving and upbeat two-wheeler segment. Its total sales grew by robust 46% to 160753 units in May 2010. The domestic sales grew by 45% to 157509 units and the exports zoomed ahead by whopping 105% to 3244 units in May 2010. The scooter segment was the sole segment in two wheeler industry to remain unaffected by the sudden recession in 2008. It has been on healthy growth trail especially from November 2006 with few occasional hiccups. Cashing on the trend, Piaggio would be re-entering the scooter segment beginning with Vespa LX 125 model. The board of Piaggio & Co has okayed a plan to invest nearly Euro 30 million over two years to establish a 1.5-lakh capacity plant that will produce a model specially developed for India, the world's second-largest two-wheeler market. The first scooter is expected to roll out by the end of 2012. Also Honda Motorcycle's (Honda) total scooter sales grew by 28% to 77695 units in May 2010 on demand. Its domestic sales grew by 28% to 76980 units while the exports grew by whopping 105% to 715 units in May 2010. However its market share slipped to 48% in May 2010 from 55% in May 2009.
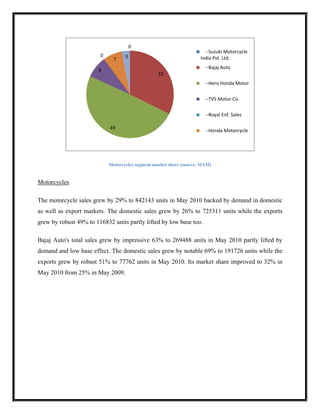
- 22. 0 --Suzuki Motorcycle 0 3 7 India Pvt. Ltd. --Bajaj Auto 8 32 --Hero Honda Motor --TVS Motor Co. --Royal Enf. Sales 49 --Honda Motorcycle Motorcycles segment market share (source: SIAM) Motorcycles The motorcycle sales grew by 29% to 842143 units in May 2010 backed by demand in domestic as well as export markets. The domestic sales grew by 26% to 725311 units while the exports grew by robust 49% to 116832 units partly lifted by low base too. Bajaj Auto's total sales grew by impressive 63% to 269488 units in May 2010 partly lifted by demand and low base effect. The domestic sales grew by notable 69% to 191726 units while the exports grew by robust 51% to 77762 units in May 2010. Its market share improved to 32% in May 2010 from 25% in May 2009.
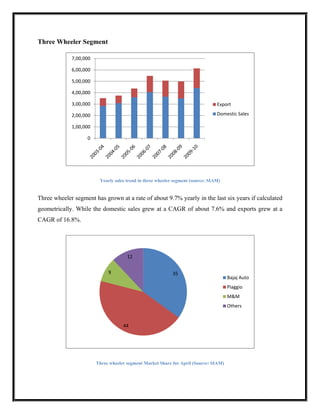
- 23. Three Wheeler Segment 7,00,000 6,00,000 5,00,000 4,00,000 3,00,000 Export 2,00,000 Domestic Sales 1,00,000 0 Yearly sales trend in three wheeler segment (source: SIAM) Three wheeler segment has grown at a rate of about 9.7% yearly in the last six years if calculated geometrically. While the domestic sales grew at a CAGR of about 7.6% and exports grew at a CAGR of 16.8%. 12 9 35 Bajaj Auto Piaggio M&M Others 44 Three wheeler segment Market Share for April (Source: SIAM)
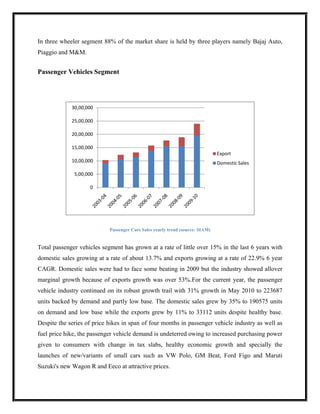
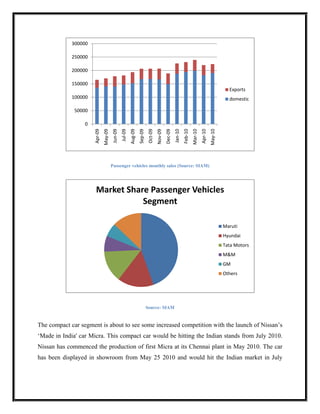
- 24. In three wheeler segment 88% of the market share is held by three players namely Bajaj Auto, Piaggio and M&M. Passenger Vehicles Segment 30,00,000 25,00,000 20,00,000 15,00,000 Export 10,00,000 Domestic Sales 5,00,000 0 Passenger Cars Sales yearly trend (source: SIAM) Total passenger vehicles segment has grown at a rate of little over 15% in the last 6 years with domestic sales growing at a rate of about 13.7% and exports growing at a rate of 22.9% 6 year CAGR. Domestic sales were had to face some beating in 2009 but the industry showed allover marginal growth because of exports growth was over 53%.For the current year, the passenger vehicle industry continued on its robust growth trail with 31% growth in May 2010 to 223687 units backed by demand and partly low base. The domestic sales grew by 35% to 190575 units on demand and low base while the exports grew by 11% to 33112 units despite healthy base. Despite the series of price hikes in span of four months in passenger vehicle industry as well as fuel price hike, the passenger vehicle demand is undeterred owing to increased purchasing power given to consumers with change in tax slabs, healthy economic growth and specially the launches of new/variants of small cars such as VW Polo, GM Beat, Ford Figo and Maruti Suzuki's new Wagon R and Eeco at attractive prices.
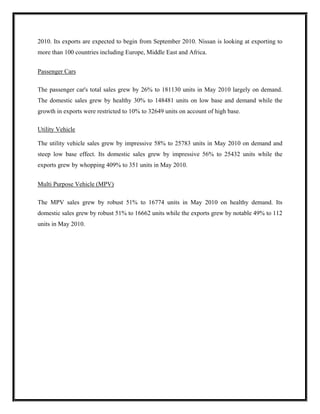
- 25. 300000 250000 200000 150000 Exports 100000 domestic 50000 0 Aug-09 Sep-09 Oct-09 Apr-09 May-09 Feb-10 Jun-09 Dec-09 Jul-09 Nov-09 Apr-10 May-10 Jan-10 Mar-10 Passenger vehicles monthly sales (Source: SIAM) Market Share Passenger Vehicles Segment Maruti Hyundai Tata Motors M&M GM Others Source: SIAM The compact car segment is about to see some increased competition with the launch of Nissan’s ‘Made in India' car Micra. This compact car would be hitting the Indian stands from July 2010. Nissan has commenced the production of first Micra at its Chennai plant in May 2010. The car has been displayed in showroom from May 25 2010 and would hit the Indian market in July
- 26. 2010. Its exports are expected to begin from September 2010. Nissan is looking at exporting to more than 100 countries including Europe, Middle East and Africa. Passenger Cars The passenger car's total sales grew by 26% to 181130 units in May 2010 largely on demand. The domestic sales grew by healthy 30% to 148481 units on low base and demand while the growth in exports were restricted to 10% to 32649 units on account of high base. Utility Vehicle The utility vehicle sales grew by impressive 58% to 25783 units in May 2010 on demand and steep low base effect. Its domestic sales grew by impressive 56% to 25432 units while the exports grew by whopping 409% to 351 units in May 2010. Multi Purpose Vehicle (MPV) The MPV sales grew by robust 51% to 16774 units in May 2010 on healthy demand. Its domestic sales grew by robust 51% to 16662 units while the exports grew by notable 49% to 112 units in May 2010.
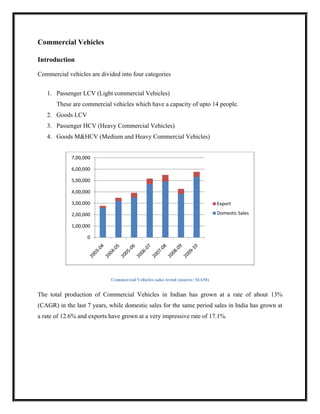
- 27. Commercial Vehicles Introduction Commercial vehicles are divided into four categories 1. Passenger LCV (Light commercial Vehicles) These are commercial vehicles which have a capacity of upto 14 people. 2. Goods LCV 3. Passenger HCV (Heavy Commercial Vehicles) 4. Goods M&HCV (Medium and Heavy Commercial Vehicles) 7,00,000 6,00,000 5,00,000 4,00,000 3,00,000 Export 2,00,000 Domestic Sales 1,00,000 0 Commercial Vehicles sales trend (source: SIAM) The total production of Commercial Vehicles in Indian has grown at a rate of about 13% (CAGR) in the last 7 years, while domestic sales for the same period sales in India has grown at a rate of 12.6% and exports have grown at a very impressive rate of 17.1%.
- 28. Current Scenario and Prospects Still year 2008-09 turned out to be especially bad for Indian commercial vehicles manufactures in which for the first time in 5 years growth slumped and in fact sales declined (21.7%) which was a result of decline in demand. Commercial vehicle industry bounced back, reporting a strong demand recovery across most segments. After posting a 21.7% drop in volumes in 2008-09, the Commercial vehicles industry achieved an impressive 38.3% growth in 2009-10, with the performance being stronger in the last four months of the fiscal year. While the Light Commercial Vehicle (LCV) segment was the first to recover, the medium & heavy commercial vehicle (M&HCV) segment followed closely with steady recovery since early 2009-10. The turnaround has been aided by a confluence of factors, including improving economic activity, favourable impact of Government mandated stimulus package and an overall improvement in the financing environment. In recent months, the growth has also been supported by some pre-buying, ahead of changes in emission norms despite the lack of clarity on timelines of implementation of emission norms. Although the medium to longer-term outlook for the CV segment remains strong, given the expectations of continued economic revival, faster infrastructure development and inter-segment shift, the growth in volumes as witnessed during the last year is likely to see some moderation owing to certain short-term challenges. These challenges include partial withdrawal of the stimulus package, expected increase in interest rates besides successive prices increases taken by OEMs to pass on the rise in input material prices. The longer-term demand drivers however remain intact, and the trend growth rates are expected to be in the region of 10-11%. Over the past twelve months, OEMs have taken successive price increases averaging 3-5% to recover the increase in input costs. In the coming months too, ICRA expects the OEMs to gradually pass on the emission norm-driven increase in costs, provided the underlying demand remains robust. This, along with the expected increase in interest rates, could in the near term, offset some of the demand recovery.
- 29. While in the past international OEMs were unable to make a major dent in the strong hold of the duopolistic structure of the CV market in India, the recent foray of the some of the domestic automotive players such as M&M in the CV space is likely to raise the competitive pitch. These players, unlike the international OEMs, have in-depth understanding of the Indian market, an established vendor base and an extensive marketing and distribution reach. However, the incumbents, in defending their market position, would continue to draw strength from their established brand franchise, extensive distribution network, and competitive cost structures. Upturn and improved financing environment driving recovery in CV segment The key indicator of underlying demand in the CV industry, the index of industrial production (IIP), has been improving steadily over the past two quarters, following strong revival in industrial activity. ICRA’s channel check suggests that much of the demand recovery in the CV segment has been driven by stronger economic activity and improvement in the operating environment for fleet operators. While freight rates (adjusted for the recent increase in fuel prices) have remained largely flat, the operating environment for fleet operators has been improving owing to lower repayment burden as a result of reduced cost of financing and longer loan tenors. The upsurge in M&HCV volumes has been supported by replacement demand originating mostly from large fleet operators. Within the M&HCV segment, demand for HCVs, particularly tractor trailers, has been strong, reflecting improving demand from container applications, and the steel, cement, and construction industries. Some of the long-term drivers for the industry also remain favourable: a. The share of roads in total freight transportation has increased following the construction of new highways that have reduced the vehicle turnaround time. While competition from the railways, especially for transportation of commodities, has increased over the last few years, overall CVs continues to offer more convenient service standards in many routes. b. The CV replacement cycle has become shorter following the launch of technologically advanced vehicles (that offer higher mileage and reliability); postponement of the proposed emission norms is also likely to lead to some further pre-buying towards the second quarter of 2010-11. The domestic M&HCV segment has seen significant recovery in volumes over the past five months. As chart 2 shows, the strong growth in H2 2009-10
- 30. albeit on a low-base, pushed the volumes to all time highs during the last few quarters. Though with some moderation I expect growth to continue on back of sustained recovery in industrial activity and some pre-buying that may come in as a result of postponement of implementation of emission norms to October 2010. Greater credit availability and lower financing costs help improve financing environment On the vehicle financing front, the competition among banks, NBFCs and the captive finance arms of the OEMs over the last several years has helped increase penetration levels. However, during the period when the volumes reached peak levels, while competition among financiers helped fleet operators reduce interest costs, over a period it also led to some deterioration in credit standards. Additionally, large fleet operators with superior creditworthiness are able to negotiate better credit terms with financiers as compared with first-time users (FTUs). Post H2, 2008-09, almost all financiers tightened their credit terms significantly, lowering the LTV ratio, insisting on more detailed documentation, and in general conducting a close greater scrutiny of loan applicants. The tightening of credit norms was brought about by the risk aversion that came to characterise the financial system in the wake of the economic slowdown and the steady increase in delinquency levels during that period. The CV segment also came to be associated with heightened risk, and as a result the cost of financing CV purchases increased substantially. Subsequently however, the risk perception associated with the CV segment started declining, although at a lag to the overall decline in interest rates in the economy. The risk perception associated with the FTU segment still continues to remain high, as reflected by a spread of almost 400-500 bps between large fleet operators and FTUs. The disbursal levels amongst CV financiers have started increasing gradually and delinquency levels, which had increased sharply during the 4-5 quarters, are showing signs of stability. Further, the LTV ratios have gone up, particularly for large fleet operators in the M&HCV segment. The LCV segment typically has a lower LTV ratio largely reflecting the high risk category customer profile.
- 31. Freight rates remain flat; hinge on further improvement in economic activity The freight rates on the major routes continue to remain largely flat except for adjustment for the recent hike in fuel prices. While freight rates on the whole are a function of the overall economic activity, regional demand supply mismatches impact local freight rates. For instance, a pick-up in industrial activity in the western & southern parts of the country tends to influence freight rates on these routes, while up north, freight rates depend largely on the agricultural output. Although in recent months there has been no appreciable increase in freight rates, the operating environment for fleet operators has improved somewhat due to reduced financing cost and better load factors. Additionally, the improving demand particularly from the large fleet operators signals an improvement in the business sentiments.
- 32. Outlook for Commercial Vehicles segment After a sharp drop in volumes during Q2, 2008-09, the Indian CV industry operated at record low capacity utilization levels for the next few quarters, leading to pressures on profitability across the entire manufacturing chain under pressure. This prompted component suppliers and OEMs to initiate several cost-cutting measures, the benefits of which along with the subsequent volume growth in 2009-10 enabled the industry to report a sharp increase in profitability. During this period, the industry also benefited from lower commodity prices and the fiscal benefits extended by the Government. The demand recovery over the last five quarters however has brought back capacity utilizations to peak levels and some of the favourable factors are now receding on the prompt of rising commodity prices and the roll-back of fiscal incentives. Also, some of the drastic measures implemented by entities across the manufacturing chain to cut employee costs during the down-turn are now being reversed. This, along with rising commodity prices, is likely to put some pressure on profitability of the manufacturers over the near term. Over the medium term, some additional capacity is expected to come on stream, although most OEMs are now operating at high outsourcing levels, moderating the impact of lower operating leverage. The medium to longer term outlook for the Indian CV industry remains robust, considering the positive view on economic activity, infrastructure development, and inter-segment shift. However, any sharp growth in volumes as that witnessed during the last one year, is unlikely as certain short-term factors appear set to moderate the upside. These factors include partial withdrawal of the stimulus package extended by the Government in wake of the global financial crisis, a likely increase in interest rates, and the limited scope for OEMs to effect price increases given that they have already resorted to the measure on multiple occasions during the past one year in order to pass on input cost escalations to customers. While the long-term growth prospects for the domestic CV industry remain favourable, the pricing flexibility of the OEMs is likely to remain constrained as new players enter the industry and capacity additions take place. Besides, the industry would also have to cope with cost pressures brought about by the proposed tightening of regulatory norms on safety and emission.
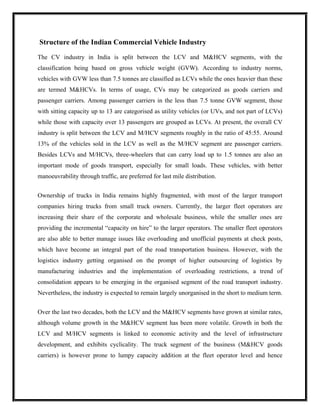
- 33. Structure of the Indian Commercial Vehicle Industry The CV industry in India is split between the LCV and M&HCV segments, with the classification being based on gross vehicle weight (GVW). According to industry norms, vehicles with GVW less than 7.5 tonnes are classified as LCVs while the ones heavier than these are termed M&HCVs. In terms of usage, CVs may be categorized as goods carriers and passenger carriers. Among passenger carriers in the less than 7.5 tonne GVW segment, those with sitting capacity up to 13 are categorised as utility vehicles (or UVs, and not part of LCVs) while those with capacity over 13 passengers are grouped as LCVs. At present, the overall CV industry is split between the LCV and M/HCV segments roughly in the ratio of 45:55. Around 13% of the vehicles sold in the LCV as well as the M/HCV segment are passenger carriers. Besides LCVs and M/HCVs, three-wheelers that can carry load up to 1.5 tonnes are also an important mode of goods transport, especially for small loads. These vehicles, with better manoeuvrability through traffic, are preferred for last mile distribution. Ownership of trucks in India remains highly fragmented, with most of the larger transport companies hiring trucks from small truck owners. Currently, the larger fleet operators are increasing their share of the corporate and wholesale business, while the smaller ones are providing the incremental “capacity on hire” to the larger operators. The smaller fleet operators are also able to better manage issues like overloading and unofficial payments at check posts, which have become an integral part of the road transportation business. However, with the logistics industry getting organised on the prompt of higher outsourcing of logistics by manufacturing industries and the implementation of overloading restrictions, a trend of consolidation appears to be emerging in the organised segment of the road transport industry. Nevertheless, the industry is expected to remain largely unorganised in the short to medium term. Over the last two decades, both the LCV and the M&HCV segments have grown at similar rates, although volume growth in the M&HCV segment has been more volatile. Growth in both the LCV and M/HCV segments is linked to economic activity and the level of infrastructure development, and exhibits cyclicality. The truck segment of the business (M&HCV goods carriers) is however prone to lumpy capacity addition at the fleet operator level and hence
- 34. experiences more severe demand shocks. The LCV segment, though cyclical, usually exhibits steadier demand patterns on account of the relatively wide usage range.
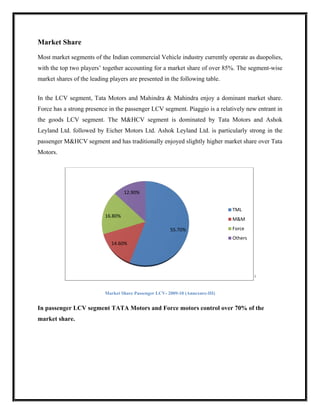
- 35. Market Share Most market segments of the Indian commercial Vehicle industry currently operate as duopolies, with the top two players’ together accounting for a market share of over 85%. The segment-wise market shares of the leading players are presented in the following table. In the LCV segment, Tata Motors and Mahindra & Mahindra enjoy a dominant market share. Force has a strong presence in the passenger LCV segment. Piaggio is a relatively new entrant in the goods LCV segment. The M&HCV segment is dominated by Tata Motors and Ashok Leyland Ltd. followed by Eicher Motors Ltd. Ashok Leyland Ltd. is particularly strong in the passenger M&HCV segment and has traditionally enjoyed slightly higher market share over Tata Motors. 12.90% TML 16.80% M&M 55.70% Force Others 14.60% i Market Share Passenger LCV- 2009-10 (Annexure-III) In passenger LCV segment TATA Motors and Force motors control over 70% of the market share.
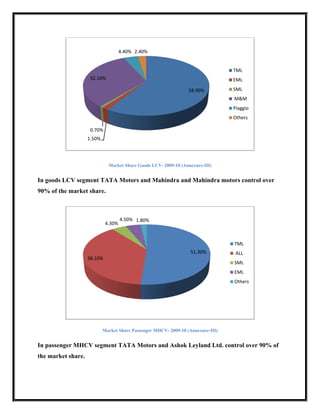
- 36. 4.40% 2.40% TML 32.10% EML 58.90% SML M&M Piaggio Others 0.70% 1.50% Market Share Goods LCV- 2009-10 (Annexure-III) In goods LCV segment TATA Motors and Mahindra and Mahindra motors control over 90% of the market share. 4.50% 1.80% 4.30% TML 51.30% ALL 38.10% SML EML Others Market Share Passenger MHCV- 2009-10 (Annexure-III) In passenger MHCV segment TATA Motors and Ashok Leyland Ltd. control over 90% of the market share.
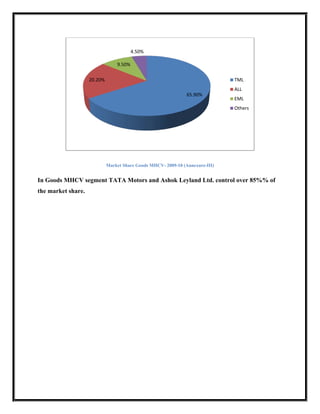
- 37. 4.50% 9.50% 20.20% TML ALL 65.90% EML Others Market Share Goods MHCV- 2009-10 (Annexure-III) In Goods MHCV segment TATA Motors and Ashok Leyland Ltd. control over 85%% of the market share.
- 38. Company in Focus: Eicher Motors Ltd. Background Eicher Motors Ltd is one of the leading manufacturers of commercial vehicles in India. Their principal activity is manufacturing and selling of commercial. They are having their manufacturing facilities at Pithampur and Dewas in Madhya Pradesh, Chennai in Tamil Nadu, Thane in Maharashtra and Gurgaon in Haryana. Eicher Motors Ltd was incorporated in the year 1982. The company in technical collaboration agreement with Mitsubishi Motor Corporation of Japan produced the Light Commercial Vehicle in India. The commercial production was commenced in their plant at Pithampur in Madhya Pradesh, with the launch of Canter truck in June 1986. The agreement with Mitsubishi ended in March 1994 after successful transfer of technology and achieving total Indigenization. The demerger of Tractors, Two-Wheelers, Engines and Gears businesses from Eicher Ltd was transferred to the company with effect from April 1, 2003. In May 25, 2005, the company acquired 100% of the shares of Design Intent Engineering Inc, USA, which is engaged in the business of providing computer aided engineering & design services for a consideration of USD 2.5 million. The company's Tractor division at Mandideep, Gears division at Parwanoo and Engines division at Alwar had been sold to TAFE Motors and Tractors Ltd, a wholly owned subsidiary of Tractors and Farm Equipment Ltd, for a consideration of Rs 310 crore with effect from June 1, 2005. The company acquired a transmission gear manufacturing plant at Dewas having a gear cutting capacity of 5 lacs gears per annum with effect form November 1, 2006. During the year 2006-07, the company acquired the 100% equity shares of Hoff and Associates (Hoff), Plymouth, Michigan (USA) along with Hoff's two wholly owned subsidiaries in Beijing and Shanghai, China for a consideration of USD 3.5 million. In order to synergize the activities between the two subsidiary companies in USA, Hoff and Associates merged with Design Intent Engineering Inc with effect from January 1, 2008 and the name of Design Intent Engineering Inc was changed to Eicher Engineering Solutions Inc.
- 39. In May 2008, the company signed a definitive agreement with Aktiebolaget Volvo, Sweden for a formation of a joint venture company through transfer of the existing Commercial Vehicle Business along with related Components and Design Services Business. In August 2008, they transferred the Components and Design Services Business to VECV, the joint venture company with effect from July 01, 2008.
- 40. Competitive Strength Eicher Motors Ltd. main competitive strength is its manufacturing capability in passenger and goods MHCV segment. Although company has presence in LCV segment but in that segment it is a very insignificant player with a market share of less than 2%. Eicher automobiles are sold mainly because of their reliability factor and because of which its sales has been consistently growing at above market rate for the last 7 years which has resulted its market share growth from 6.9% to 9.5% in goods MHCV segment. Eicher entered the passenger MHCV segment in 2002 and it has already captured the 4.5% of fast growing passenger MHCV segment. This growth is a result of conscious effort of the Eicher management. In the last 7 years Eichers presence in LCV segment has been declining and I expect it will soon exit from that segment. Company also draws its strength from its strong product line which caters all the segments of MHCV segment. Company also manufactures 2 wheelers by the brand Royal Enfield, but that also captures a very niche segment and does not amount to a significant portion of Eicher’s revenues. Other competitive strength for will be its size its size is much smaller than industry leaders like TATA and M&M and it provides Eicher with a great amount of flexibility in terms of strategy but it becomes a disadvantage because of lower economies of scale.
- 41. Historical Data Profit and Loss Account Consolidated 200912 200812 200703 200603 (12) (9) (12) (12) INCOME : Sales Turnover 3112.22 1882.48 2252.81 1880.82 Excise Duty 167.96 165.72 269.55 220.74 Net Sales 2944.26 1716.76 1983.26 1660.08 Other Income 111.9 111.44 35.01 210.79 Stock Adjustments -98.19 91.31 -5.57 40.71 Total Income 2957.97 1919.51 2012.7 1911.58 EXPENDITURE : Raw Materials 2113.23 1382.96 1431.03 1266.92 Power & Fuel Cost 20.86 12.63 14.86 13.19 Employee Cost 215.17 156.11 134.56 122.37 Other Manufacturing Expenses 38.56 28.63 35.96 30.13 Selling and Administration Expenses 265.98 192.18 222.19 189.14 Miscellaneous Expenses 54.44 41.72 37.91 29.33 Less: Pre-operative Expenses Capitalised 0.13 0.3 0.64 0.19 Total Expenditure 2708.11 1813.93 1875.87 1650.89 Operating Profit 249.86 105.58 136.83 260.69 Interest 8.67 9.93 14.82 16.89 Gross Profit 241.19 95.65 122.01 243.8 Depreciation 53.88 36.89 45.13 50.19 Minority Interest (before tax) 0 0 0 0 Profit Before Tax 187.31 58.76 76.88 193.61 Tax 24.9 32.99 28.54 4 Fringe Benefit Tax 0.3 1.52 1.7 2.09 Deferred Tax 32.62 -43.04 -6.09 -24.42 Net Profit 129.49 67.29 52.73 211.94 Minority Interest (after tax) 46.1 4.69 0 0 Profit/Loss of Associate Company 0 0 0 0 Net Profit after Minority Interest & P/L Asso.Co. 83.39 62.6 52.73 211.94 Extraordinary Items -0.73 17.05 0 167.86 Adjusted Net Profit 84.12 45.55 52.73 44.08 Adjst. below Net Profit -95.24 0 0 0 P & L Balance brought forward 358.34 316.08 330.37 151.91 Statutory Appropriations 0 0 0 0 Appropriations 35.36 20.34 99.03 33.48 P & L Balance carried down 311.13 358.34 284.07 330.37
- 42. Dividend 18.69 14.05 81.47 11.24 Preference Dividend 0 0 0 0 Equity Dividend (%) 70 50 290 40 EPS before Minority Interest (Unit Curr.) 99.77 30.81 14.7 74.89 EPS before Minority Interest (Adj) (Unit Curr.) 100 31 15 75 EPS after Minority Interest (Unit Curr.) 63.36 28.58 14.7 74.89 EPS after Minority Interest (Adj) (Unit Curr.) 63.36 28.58 14.7 74.89 Book Value (Unit Curr.) 833.34 392.91 142.51 156.74 Key Points: • Company has changed its result announcement date from March to December in December 2008 hence the decline in numbers. • In reality company has been consistently performing and it can be seen from its last four consolidated results.
- 43. Balance Sheet: Consolidated 200912 200812 200803 200703 200603 SOURCES OF FUNDS : Share Capital 26.69 28.09 28.09 28.09 28.09 Reserves Total 1042.35 1075.6 407.75 372.23 412.18 Equity Share Warrants 0 0 0 0 0 Equity Application Money 0 0 0 0 0 Total Shareholders Funds 1069.04 1103.69 435.84 400.32 440.27 Minority Interest 574.67 530.53 0 0 0 Secured Loans 73.52 108.81 160.02 138.32 97.23 Unsecured Loans 52.85 56.8 59.51 79.34 89.93 Total Debt 126.37 165.61 219.53 217.66 187.16 Total Liabilities 1770.08 1799.83 655.37 617.98 627.43 APPLICATION OF FUNDS : Gross Block 743.69 678.3 611.19 548.29 515.88 Less: Accumulated Depreciation 380.17 349.08 296.45 246.75 209.66 Less: Impairment of Assets 0 0 0 0 0 Net Block 363.52 329.22 314.74 301.54 306.22 Lease Adjustment 0 0 0 0 0 Capital Work in Progress 12.23 51.76 19.44 8.62 7.37 Producing Properties 0 0 0 0 0 Investments 294.11 6.24 261.24 261.24 258.01 Current Assets, Loans & Advances Inventories 218.96 338.07 210.38 168.91 161.23 Sundry Debtors 232.53 180.19 148.18 195.03 123.09 Cash and Bank 1170.65 1231.8 51.93 48.05 27.51 Loans and Advances 189.99 150.99 113.08 207.33 177.33 Total Current Assets 1812.13 1901.05 523.57 619.32 489.16 Less : Current Liabilities and Provisions Current Liabilities 601.55 419.29 374.8 411.45 291.37 Provisions 96.2 83.87 53.5 125.35 101.41 Total Current Liabilities 697.75 503.16 428.3 536.8 392.78 Net Current Assets 1114.38 1397.89 95.27 82.52 96.38 Miscellaneous Expenses not written off 0 0 0 0.63 2.09 Deferred Tax Assets 15.44 47.76 19.29 16.2 11.59 Deferred Tax Liability 29.6 33.04 54.61 52.77 54.23 Net Deferred Tax -14.16 14.72 -35.32 -36.57 -42.64 Total Assets 1770.08 1799.83 655.37 617.98 627.43 Contingent Liabilities 117.03 91.47 80.87 122.97 122.58
- 44. Key Financial Ratios 200912 200812 200803 200703 200603 Equity Paid Up 12.66 28.09 28.09 28.09 28.09 Networth 1055.01 1103.69 435.84 400.32 440.27 Capital Employed 1195.41 1269.3 655.37 617.98 627.43 Gross Block 743.69 678.3 611.19 548.29 515.88 Net Working Capital ( Incl. Def. Tax) 1100.22 1412.61 59.95 45.95 53.74 Current Assets ( Incl. Def. Tax) 1827.57 1948.81 542.86 635.52 500.75 Current Liabilities and Provisions ( Incl. Def. Tax) 727.35 536.2 482.91 589.57 447.01 Total Assets/Liabilities (excl Reval & W.off) 1922.76 1805.5 1138.28 1206.92 1072.35 Gross Sales 3112.22 1882.48 2572.56 2252.81 1880.82 Net Sales 2944.26 1716.76 2258.2 1983.26 1660.08 Other Income 111.9 111.44 40.95 35.01 210.79 Value Of Output 2846.07 1808.07 2300.31 1977.69 1700.79 Cost of Production 2441.81 1622.85 1943.9 1662.58 1489.4 Selling Cost 183.18 142.49 204.11 174.51 137.89 PBIDT 249.86 105.58 145.56 136.83 260.69 PBDT 241.19 95.65 126.54 122.01 243.8 PBIT 195.98 68.69 94.84 91.7 210.5 PBT 187.31 58.76 75.82 76.88 193.61 PAT 129.49 67.29 54.76 52.73 211.94 CP 183.37 104.18 105.48 97.86 262.13 Revenue earnings in forex 30.26 52.1 170.22 155.66 122.78 Revenue expenses in forex 7.58 11.54 30.47 28.74 28.76 Capital earnings in forex 0 0 0 0 0 Capital expenses in forex 2.41 3.37 15.86 5.44 9.39 Book Value (Unit Curr) 833.34 392.91 155.16 142.51 156.74 Market Capitalisation 1748.86 660.12 703.51 695.65 857.87 CEPS (annualised) (Unit Curr) 142.33 36.24 36.7 30.77 92.76 EPS (annualised) (Unit Curr) 99.77 30.81 18.64 14.7 74.89 Dividend (annualised%) 70 66.67 50 290 40 Payout (%) 14.8 21.65 26.83 197.26 5.34 Cash Flow From Operating Activities 368.46 -89 84.79 133.66 -5.97 Cash Flow From Investing Activities -276.42 265.49 -64.41 -23.32 -13.12 Cash Flow From Financing Activities -164.05 1003.38 -16.5 -89.8 15.55 Rate of Growth (%) ROG-Net Worth (%) -4.41 153.23 8.87 -9.07 0 ROG-Capital Employed (%) -5.82 93.68 6.05 -1.51 0 ROG-Gross Block (%) 9.64 10.98 11.47 6.28 0 ROG-Gross Sales (%) 65.33 -26.82 14.19 19.78 0 ROG-Net Sales (%) 71.5 -23.98 13.86 19.47 0 ROG-Cost of Production (%) 51.11 -16.82 17.06 12.01 0 ROG-Total Assets (%) 6.49 58.62 -5.69 12.55 0 ROG-PBIDT (%) 136.65 -27.47 6.38 -47.51 0 ROG-PBDT (%) 152.16 -24.41 3.71 -49.95 0 ROG-PBIT (%) 185.31 -27.57 3.42 -56.44 0
- 45. ROG-PBT (%) 218.77 -22.5 -1.38 -60.29 0 ROG-PAT (%) 92.44 22.88 3.85 -75.12 0 ROG-CP (%) 76.01 -1.23 7.79 -62.67 0 ROG-Revenue earnings in forex (%) -41.92 -69.39 9.35 26.78 125.66 ROG-Revenue expenses in forex (%) -34.32 -62.13 6.02 -0.07 -18.37 ROG-Market Capitalisation (%) 164.93 -6.17 1.13 -18.91 -1.48 Key Ratios Debt-Equity Ratio 0.09 0.19 0.52 0.48 0.43 Long Term Debt-Equity Ratio 0.06 0.12 0.21 0.11 0.09 Current Ratio 2.79 2.14 0.88 0.84 0.84 Turnover Ratios Fixed Assets Ratio 4.38 3.89 4.44 4.23 3.65 Inventory Ratio 11.17 9.15 13.57 13.65 11.67 Debtors Ratio 15.08 15.29 14.99 14.16 15.28 Interest Cover Ratio 22.6 3.03 4.99 6.19 2.43 PBIDTM (%) 8.03 3.56 5.66 6.07 4.85 PBITM (%) 6.3 1.6 3.69 4.07 2.18 PBDTM (%) 7.75 3.03 4.92 5.42 3.95 CPM (%) 5.89 4.63 4.1 4.34 5.01 APATM (%) 4.16 2.67 2.13 2.34 2.34 ROCE (%) 10.98 3.26 14.9 14.76 6.56 RONW (%) 7.93 6.47 13.1 12.55 10.01 Debtors Velocity (Days) 24 22 36 29 0 Creditors Velocity (Days) 61 50 69 63 0 Assets Utilisation Ratio (times) Value of Output/Total Assets 1.53 1.86 1.2 1.26 0 Value of Output/Gross Block 4 4.2 2.95 3.03 0 Key points: • Profit margin constantly improving. • Cash-Flow from operating activities increasing. • Reduced D/E ratio. o Higher Cost of Capital. o Lower risk of bankruptcy. • Operating leverage increasing • Net sales growth, ROCE, Interest coverage ratio improved.
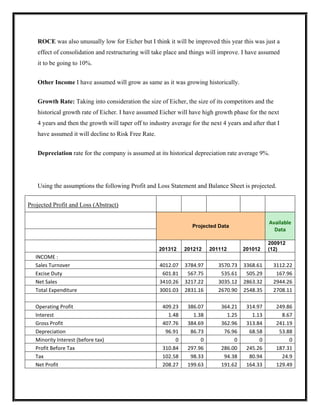
- 46. Financial Projections Assumptions Serial No. 2017 2016 2015 2014 2013 2012 2011 2010 EBITDA 1 0.12 0.12 0.12 0.12 0.12 0.12 0.11 0.1 D/E 2 0.02 0.02 0.02 0.02 0.02 0.02 0.02 0.02 dividend payout ratio 3 0.5 0.5 0.5 0.5 0.5 0.4 0.3 0.2 Plough back ratio 4 0.5 0.5 0.5 0.5 0.5 0.6 0.7 0.8 Excise Duty 5 0.15 0.15 0.15 0.15 0.15 0.15 0.15 0.15 Other income growth 6 0.12 0.12 0.12 0.12 0.12 0.12 0.12 0.12 Depreciation 7 0.09 0.09 0.09 0.09 0.09 0.09 0.09 0.09 ROCE 8 0.1 0.1 0.1 0.1 0.1 0.1 0.1 0.1 Reinvestment rate 9 0.45 0.45 0.45 0.5 0.6 0.6 0.6 0.75 Growth Rate 10 0.05 0.05 0.05 0.05 0.06 0.06 0.06 0.08 Cash 12 0.05 0.05 0.05 0 -0.1 0 0.1 0.05 Debt-Equity Ratio for Eicher is unusually low. Company has done it deliberately therefore I think it is a pre-takeover exercise. Since what will be implications of takeover cannot be predicted I have assumed it continue at this debt level. EBDITA for Eicher Motors Ltd is unually low at 9.5% and it was even lower prior to 2009 infact in the last few years EBIDTA has improved. Taking into considerations already discussed above about industry senerio and the fact that Eicher works on least possible or no Debt. Eicher cannot have a Cost of Capital comparative to its competitors. I expect it to follow the trend and go up to 12%.
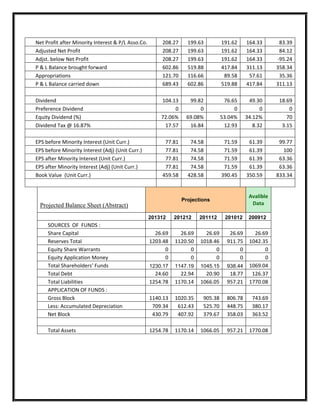
- 47. ROCE was also unusually low for Eicher but I think it will be improved this year this was just a effect of consolidation and restructuring will take place and things will improve. I have assumed it to be going to 10%. Other Income I have assumed will grow as same as it was growing historically. Growth Rate: Taking into consideration the size of Eicher, the size of its competitors and the historical growth rate of Eicher. I have assumed Eicher will have high growth phase for the next 4 years and then the growth will taper off to industry average for the next 4 years and after that I have assumed it will decline to Risk Free Rate. Depreciation rate for the company is assumed at its historical depreciation rate average 9%. Using the assumptions the following Profit and Loss Statement and Balance Sheet is projected. Projected Profit and Loss (Abstract) Available Projected Data Data 200912 201312 201212 201112 201012 (12) INCOME : Sales Turnover 4012.07 3784.97 3570.73 3368.61 3112.22 Excise Duty 601.81 567.75 535.61 505.29 167.96 Net Sales 3410.26 3217.22 3035.12 2863.32 2944.26 Total Expenditure 3001.03 2831.16 2670.90 2548.35 2708.11 Operating Profit 409.23 386.07 364.21 314.97 249.86 Interest 1.48 1.38 1.25 1.13 8.67 Gross Profit 407.76 384.69 362.96 313.84 241.19 Depreciation 96.91 86.73 76.96 68.58 53.88 Minority Interest (before tax) 0 0 0 0 0 Profit Before Tax 310.84 297.96 286.00 245.26 187.31 Tax 102.58 98.33 94.38 80.94 24.9 Net Profit 208.27 199.63 191.62 164.33 129.49
- 48. Net Profit after Minority Interest & P/L Asso.Co. 208.27 199.63 191.62 164.33 83.39 Adjusted Net Profit 208.27 199.63 191.62 164.33 84.12 Adjst. below Net Profit 208.27 199.63 191.62 164.33 -95.24 P & L Balance brought forward 602.86 519.88 417.84 311.13 358.34 Appropriations 121.70 116.66 89.58 57.61 35.36 P & L Balance carried down 689.43 602.86 519.88 417.84 311.13 Dividend 104.13 99.82 76.65 49.30 18.69 Preference Dividend 0 0 0 0 0 Equity Dividend (%) 72.06% 69.08% 53.04% 34.12% 70 Dividend Tax @ 16.87% 17.57 16.84 12.93 8.32 3.15 EPS before Minority Interest (Unit Curr.) 77.81 74.58 71.59 61.39 99.77 EPS before Minority Interest (Adj) (Unit Curr.) 77.81 74.58 71.59 61.39 100 EPS after Minority Interest (Unit Curr.) 77.81 74.58 71.59 61.39 63.36 EPS after Minority Interest (Adj) (Unit Curr.) 77.81 74.58 71.59 61.39 63.36 Book Value (Unit Curr.) 459.58 428.58 390.45 350.59 833.34 Avalible Projections Projected Balance Sheet (Abstract) Data 201312 201212 201112 201012 200912 SOURCES OF FUNDS : Share Capital 26.69 26.69 26.69 26.69 26.69 Reserves Total 1203.48 1120.50 1018.46 911.75 1042.35 Equity Share Warrants 0 0 0 0 0 Equity Application Money 0 0 0 0 0 Total Shareholders’ Funds 1230.17 1147.19 1045.15 938.44 1069.04 Total Debt 24.60 22.94 20.90 18.77 126.37 Total Liabilities 1254.78 1170.14 1066.05 957.21 1770.08 APPLICATION OF FUNDS : Gross Block 1140.13 1020.35 905.38 806.78 743.69 Less: Accumulated Depreciation 709.34 612.43 525.70 448.75 380.17 Net Block 430.79 407.92 379.67 358.03 363.52 Total Assets 1254.78 1170.14 1066.05 957.21 1770.08
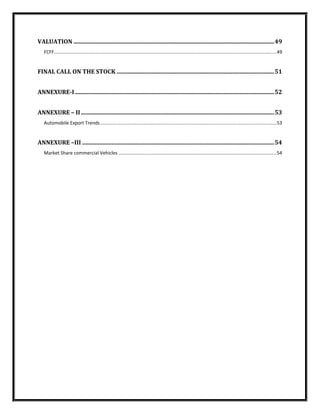
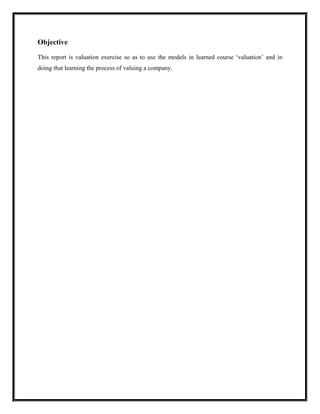
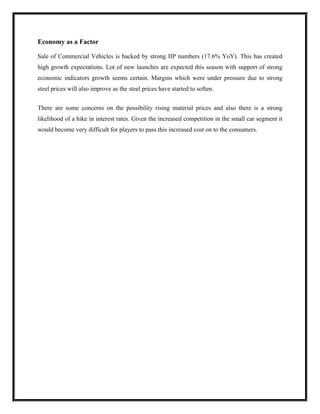
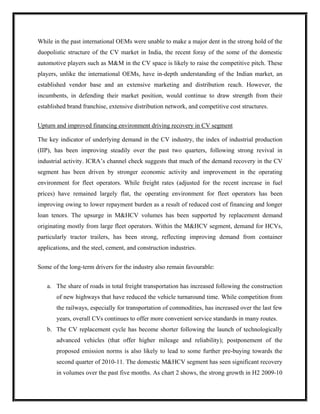
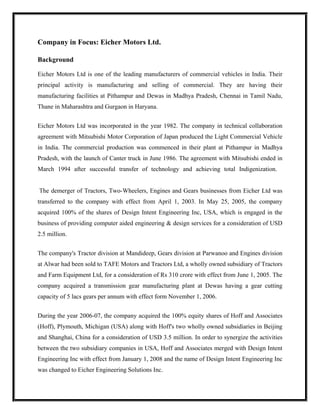
- 49. Valuation To value Eicher Motors Ltd. Free Cash Flow to Firm Method is used and above given Profit and Loss statement and Balance Sheet are used in conjugation with the assumptions following cashfow is prepared. FCFF Avalible Projected Projected Projected Projected Data particulars 201312 201212 201112 201012 200912 EBIT(1-t) 234.248181 212.269097 192.462306 165.0804577 131.3066 Net Capital Expenditure[Capital Expenditure- Depriciation] 29.30 28.24 21.64 -5.49 11.51 Change in Working Capital Calculation of Growth Rate(R.R*ROC) 9.00% 10.80% 10.80% 6.00% 8.24% 1) ROC 18.00% 18.00% 18.00% 10.00% 10.98% EBIT(1-T) 234.25 212.27 192.46 165.08 131.31 Book Value of Equity&Debt 1259.742161 1170.138698 1066.054994 957.2088 1195.41 2) Reinvestment Rate 0.50 0.60 0.60 0.60 0.75 Capex 126.81 114.97 98.60 63.09 11.51 Change in WC 0.00 0.00 0.00 0.00 0.00 EBIT(1-T) 234.25 212.27 192.46 165.08 131.31 FCFF 263.55 240.51 214.10 159.59 142.82 WACC 0.11 0.11 0.11 0.11 0.11 Present value 176.48 178.04 158.49 130.60 129.19
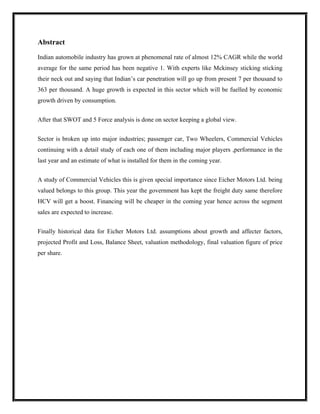
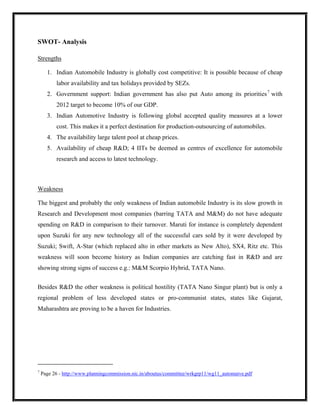
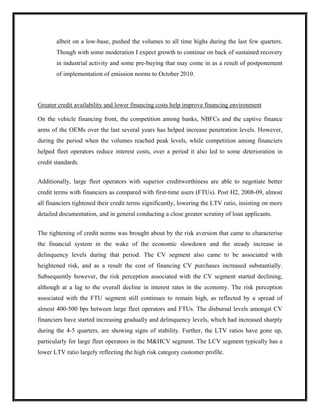
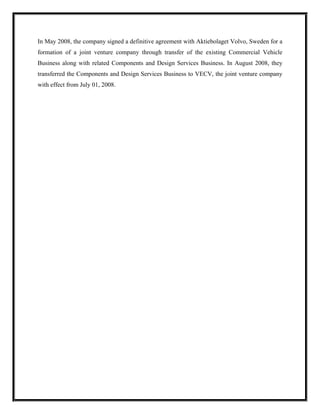
- 50. Projected Projected Projected particulars 201612 201512 201412 EBIT(1-t) 296.1081482 274.5216053 254.568314 Net Capital Expenditure[Capital Expenditure- Depreciation] -4.56 -3.04 9.21 Change in Working Capital Calculation of Growth Rate(R.R*ROC) 8.10% 8.10% 8.10% 1) ROC 18.00% 18.00% 18.00% EBIT(1-T) 296.11 274.52 254.57 Book Value of Equity&Debt 1582.005215 1466.107834 1358.634018 2) Reinvestment Rate 0.45 0.45 0.45 Capex 123.02 114.07 116.63 Change in WC 0.00 0.00 0.00 EBIT(1-T) 296.11 274.52 254.57 FCFF 291.55 271.48 263.77 WACC 0.11 0.11 0.11 Present value 144.52 148.76 159.78
- 51. Final CALL on the Stock My estimate of price is at Rs. 1251. Short Term view: Weak HOLD. The Stock is fairly valued. Long Term View: BUY. Auto sector is going be the next IT. Auto sector is receiving phenomenal amount of investment and fundamentally good companies like Eicher Motors Ltd. bound to have a great future as India becomes a major auto exporter on a global scale.
- 52. Annexure-I
- 53. Annexure – II Automobile Export Trends Number of Vehicles Category 2003-04 2004-05 2005-06 2006-07 2007-08 2008-09 2009-10 CAGR (%) Passenger Vehicles 1,29,291 1,66,402 1,75,572 1,98,452 2,18,401 3,35,729 4,46,146 22.93% Commercial Vehicles 17,432 29,940 40,600 49,537 58,994 42,625 45,007 17.13% Three Wheelers 68,144 66,795 76,881 1,43,896 1,41,225 1,48,066 1,73,282 16.83% Two Wheelers 2,65,052 3,66,407 5,13,169 6,19,644 8,19,713 10,04,174 11,40,184 27.53% Grand Total 4,79,919 6,29,544 8,06,222 10,11,529 12,38,333 15,30,594 18,04,619 24.70% Source "Society of Indian Automobile Manufacturers (SIAM)"
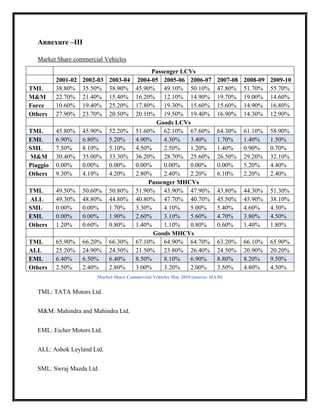
- 54. Annexure –III Market Share commercial Vehicles Passenger LCVs 2001-02 2002-03 2003-04 2004-05 2005-06 2006-07 2007-08 2008-09 2009-10 TML 38.80% 35.50% 38.90% 45.90% 49.10% 50.10% 47.80% 51.70% 55.70% M&M 22.70% 21.40% 15.40% 16.20% 12.10% 14.90% 19.70% 19.00% 14.60% Force 10.60% 19.40% 25.20% 17.80% 19.30% 15.60% 15.60% 14.90% 16.80% Others 27.90% 23.70% 20.50% 20.10% 19.50% 19.40% 16.90% 14.30% 12.90% Goods LCVs TML 45.80% 45.90% 52.20% 51.60% 62.10% 67.60% 64.30% 61.10% 58.90% EML 6.90% 6.80% 5.20% 4.90% 4.30% 3.40% 1.70% 1.40% 1.50% SML 7.50% 8.10% 5.10% 4.50% 2.50% 1.20% 1.40% 0.90% 0.70% M&M 30.40% 35.00% 33.30% 36.20% 28.70% 25.60% 26.50% 29.20% 32.10% Piaggio 0.00% 0.00% 0.00% 0.00% 0.00% 0.00% 0.00% 5.20% 4.40% Others 9.30% 4.10% 4.20% 2.80% 2.40% 2.20% 6.10% 2.20% 2.40% Passenger MHCVs TML 49.50% 50.60% 50.80% 51.90% 43.90% 47.90% 43.80% 44.30% 51.30% ALL 49.30% 48.80% 44.80% 40.80% 47.70% 40.70% 45.50% 45.90% 38.10% SML 0.00% 0.00% 1.70% 3.30% 4.10% 5.00% 5.40% 4.60% 4.30% EML 0.00% 0.00% 1.90% 2.60% 3.10% 5.60% 4.70% 3.80% 4.50% Others 1.20% 0.60% 0.80% 1.40% 1.10% 0.80% 0.60% 1.40% 1.80% Goods MHCVs TML 65.90% 66.20% 66.30% 67.10% 64.90% 64.70% 63.20% 66.10% 65.90% ALL 25.20% 24.90% 24.50% 21.50% 23.80% 26.40% 24.50% 20.90% 20.20% EML 6.40% 6.50% 6.40% 8.50% 8.10% 6.90% 8.80% 8.20% 9.50% Others 2.50% 2.40% 2.80% 3.00% 3.20% 2.00% 3.50% 4.80% 4.50% Market Share Commercial Vehicles May 2010 (source: SIAM) TML: TATA Motors Ltd. M&M: Mahindra and Mahindra Ltd. EML: Eicher Motors Ltd. ALL: Ashok Leyland Ltd. SML: Swraj Mazda Ltd.
- 55. Refrences • International Organization for motor vehicle manufacturers • Society of Indian Automobile Manufacturers (SIAM) • http://www.planningcommission.nic.in/aboutus/committee/wrkgrp11/wg11_automaive.p df • Page 24 – (3rd BRIC Report) http://www2.goldmansachs.com/ideas/brics/brics-at- 8/BRICS-doc.pdf • http://economictimes.indiatimes.com/news/news-by-industry/auto/automobiles/Auto-cos- lines-up-30-bn-investment-in-4-years/articleshow/6009682.cms • Badri Narayanan G. and Pankaj Vashisht: Determinants of Competitiveness of the Indian Auto Industry • Michel Porter: Competitive Strategies • Databases o Moneycontrol.com o CMIE: IAS o Capitaline.com